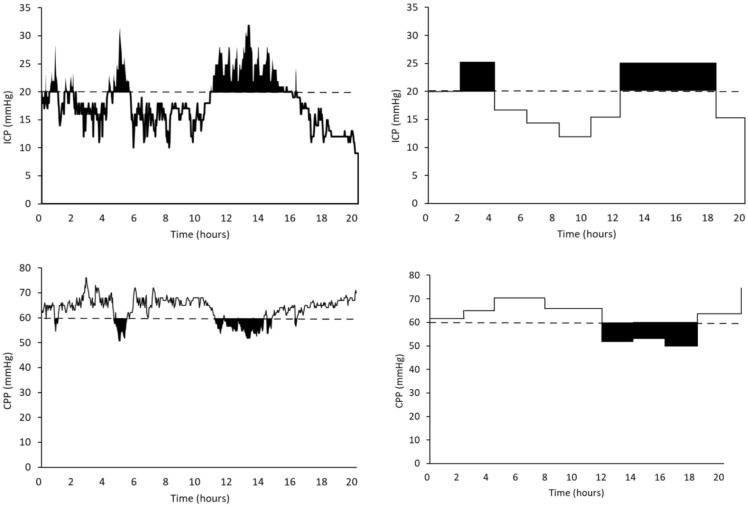
Fig. 3.
Calculation of intracranial pressure (ICP) pressure–time dose (PTDICP) and cerebral perfusion pressure (CPP) pressure–time dose (PTDCPP). Upper left panel: the black area presents the PTDICP for the ICP threshold (ICP > 20 mm Hg, dashed line) from high-resolution (HR) data. Upper right panel: the black area presents the PTDICP for the ICP threshold (ICP > 20 mm Hg, dashed line) from the manually recorded (MR) data in the same patients. Because MR data were discontinuous, we used the staircase method for interpolation [19]. This assumes that an elevated ICP epoch begins at the first point at which an ICP > 20 mm Hg is recorded and ends when a new ICP is 20 mm Hg or lower. Lower left panels: the black area presents the PTDCPP for the CPP threshold (CPP < 60 mm Hg, dashed line) from HR data. Lower right panel: the black area presents the PTDCPP for the CPP threshold (CPP < 60 mm Hg, dashed line) from the MR data in the same patient, using the staircase method for interpolation [19]

