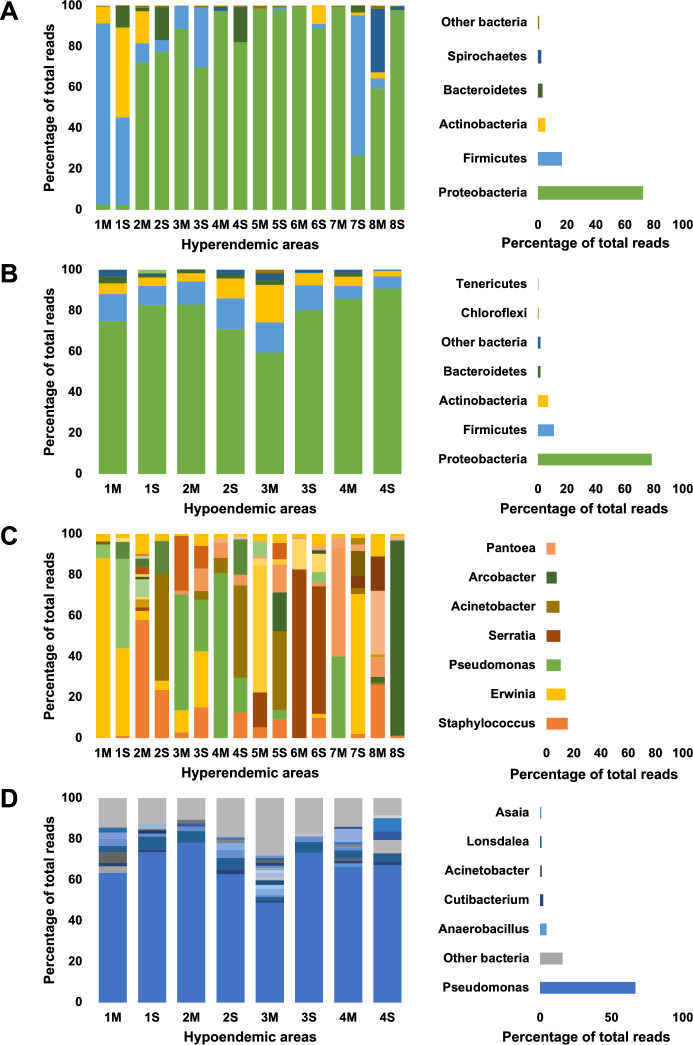
Figure 3.
Microbiome profiles of adult Anopheles sinensis mosquitoes at phylum and genus levels. Left side-bar plots represent the microbiome profiles of adult female Anopheles sinensis mosquitoes collected from 12 regions which are divided into hyperendemic (A: phylum level, C: genus level) and hypoendemic (B: phylum level, D: genus level) areas. Each bar represents the microbiome profile of pooled sample by organ and region (M: mid-gut, S: salivary glands). Right side-bar plots represent the average of all regions.

