Figure 5.
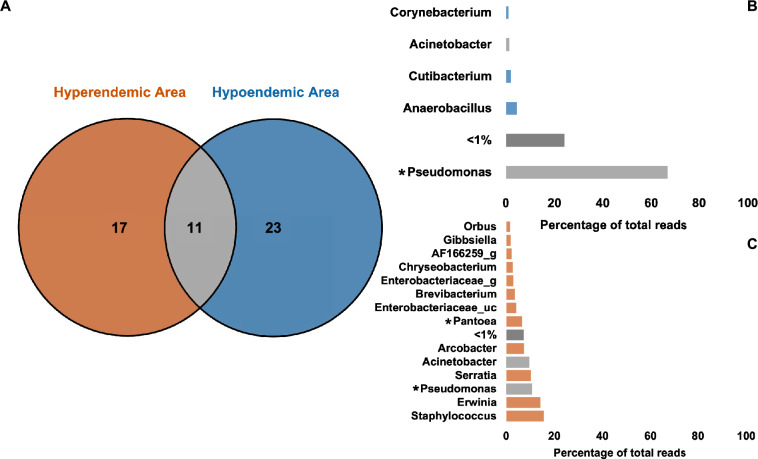
(A) Venn diagram analysis of shared genera by epidemiology. (B) Microbiome average profile of hyperendemic and (C) hypoendemic areas. Mosquitoes in hypoendemic and hyperendemic areas share 11 microbiotas, with 23 and 17 unique microbiotas identified in each. Pseudomonas is observed in both areas, which is much more prevalent in the hypoendemic area. Staphylococcus had the highest prevalence in the hyperendemic area, followed by Erwinia, Pseudomonas, Serratia, Acinetobacter, Arcobacter, and Pantoea. Pseudomonas and Pantoea were the statistically significant microbiotas.

