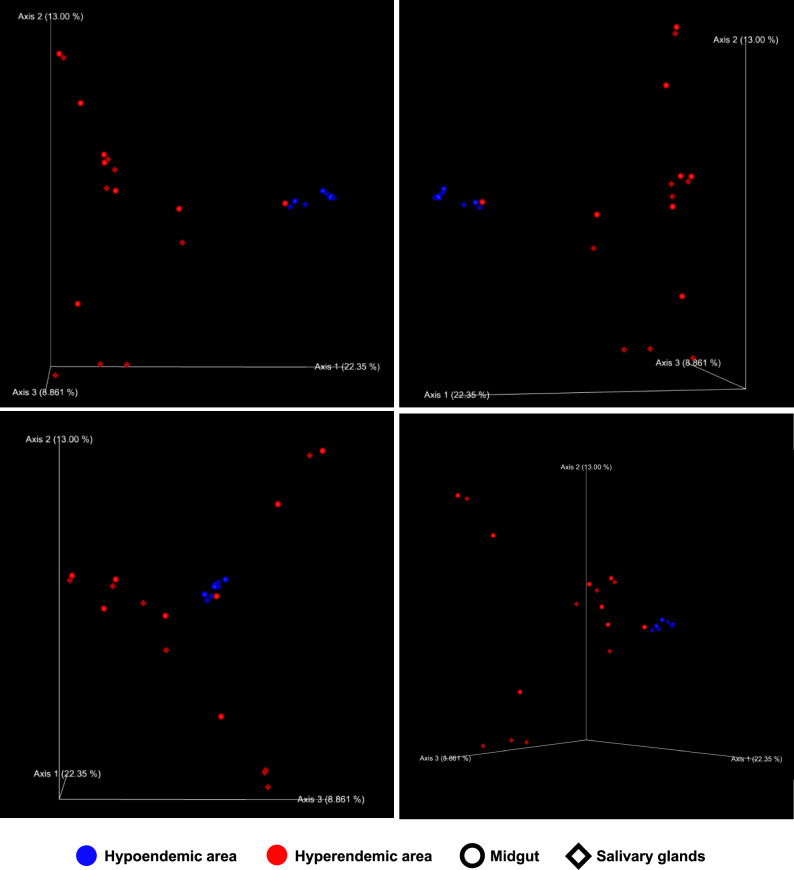
Figure 6.
3D principal coordinated analysis (PCoA) plots of the Bray–Curtis distances of adult female Anopheles sinensis microbiome diversity according to epidemiology and organ This figure offers images that were shot in a multiple ranges of angles. The PCoA plot is a graph in which the distance between areas is estimated based on their dissimilarity in terms of relative abundance (Bray–Curtis). It can be seen that samples from the hyperendemic area are spread by a greater distance than those from the hypoendemic area, while samples from the hypoendemic area are closer together.

