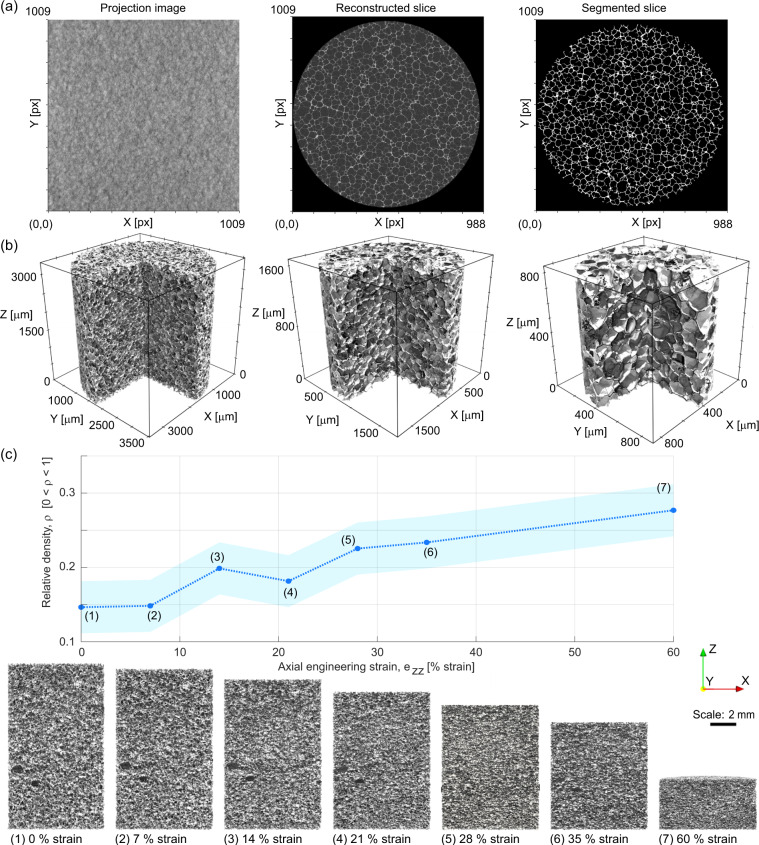
Fig. 2.
Examples of data included in the μCT dataset. (a) Example raw projection image, a grayscale reconstruction of a horizontal slice, and a different binarized horizontal slice. (b) 3D renderings of the three “baseline” high-quality μCT images, with increasing resolution (higher magnification) left to right. (c) Example usage of in-situμCT. The plot on the top shows relative density computed from the lower resolution (“4X02”) segmented 3D images plotted against applied strain, showing a generally increasing trend in density as compressive engineering strain increases from 0 % strain to 60 % strain (the variation from this trend is likely due to generally low contrast images and variations in imaging settings necessitated by the applied compression). The shaded region shows the standard uncertainty derived from a sensitivity analysis on key segmentation parameters. The images below the plot show vertical slices of the reconstructed volume image of the foam at each strain step. These images show the center plane of each specimen. They can be used to, for example, identify morphology and deformation habits of specific features within the 3D structure or investigate inhomogeneities (e.g., compaction banding) during the deformation.

