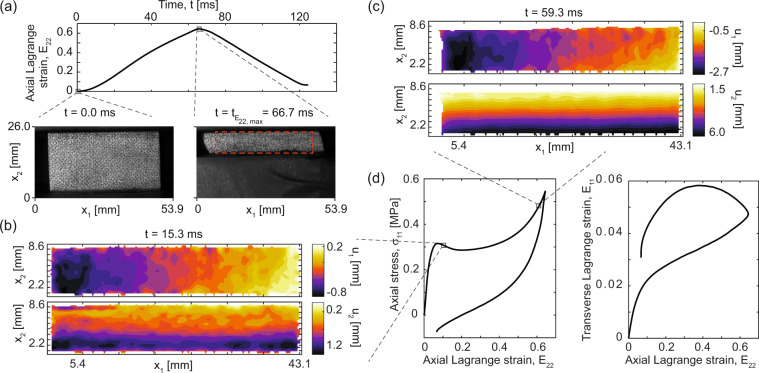
Fig. 4.
Example data from a single typical intermediate rate compression experiment at the fastest rate (nominally 10 s−1 or equivalently 250 mm/s). (a) Time-history of mean axial Lagrangian strain (E22), with example images selected at zero compression and maximum compression. The red dashed box indicates the region of interest used for DIC. (b) Example 2D-DIC displacement fields (u1, top, and u2, bottom) on the specimen surface at approximately 15 % mean axial strain. Note that u1 is nominally symmetric about the vertical centerline and the u2 component is maximum at the bottom edge and minimum at the top edge, since the uniaxial compression is applied between a fixed top platen and moving bottom platen (in contrast to the quasi-static case). (c) Analogously to (b), the 2D-DIC displacement fields (u1, top, and u2, bottom) on the specimen surface at approximately 60 % mean axial strain, showing a less even and noisier gradient in u2, which is may be related to the non-monotonicity of the stress-strain curve at this rate and strain level and increased uncertainty associated with the high-speed imaging configuration. (d) The axial engineering stress and mean transverse Lagrangian strain plotted against the mean axial Lagrangian strain for one example. Standard uncertainty on stress is circa ±1.1 kPa.

