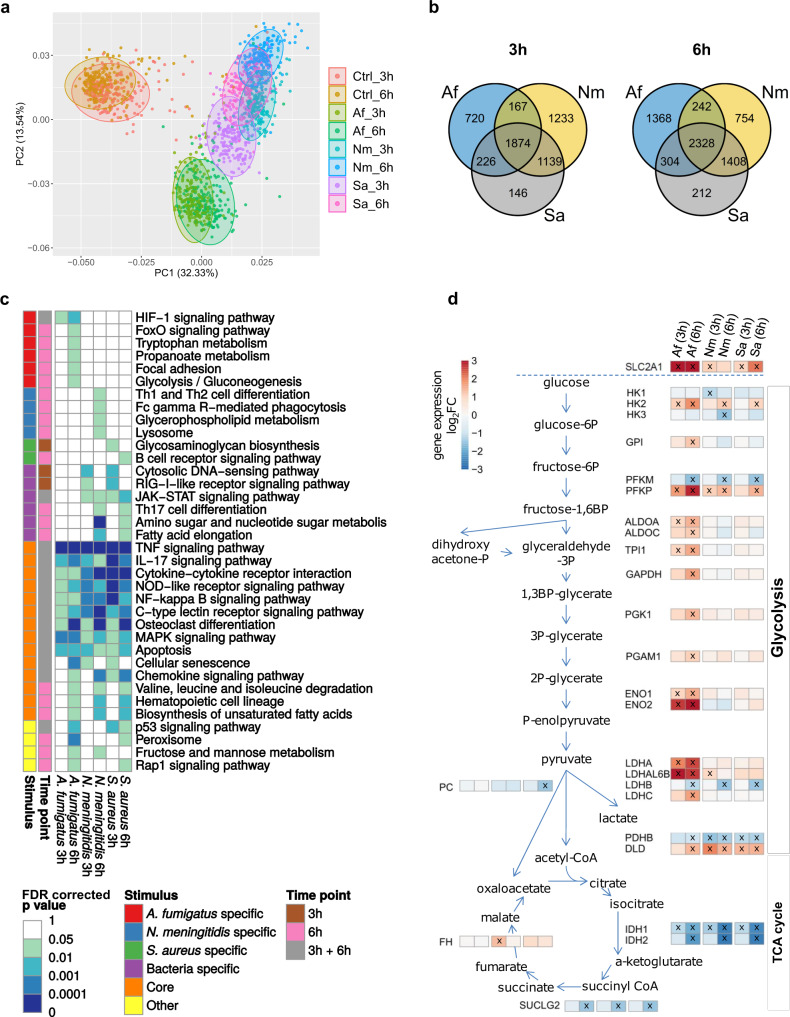
Fig. 1. Overview of the transcriptional immune response in human monocytes.
a Principal component analysis of RNA-sequencing data of monocytes from 215 healthy volunteers. Each dot is one individual’s transcriptional response in unstimulated monocytes (Ctrl) and after exposure to A. fumigatus (Af), N. meningitidis (Nm), or S. aureus (Sa) for 3 h and 6 h. Colors indicate stimulus and timepoint. b Venn diagrams of all differentially expressed genes (DEGs) at 3 h (left) and 6 h (right). Besides a pathogen-independent core immune response a substantial set of DEGs was specific for A. fumigatus. DEG sets induced by both bacteria were mostly overlapping. c Pathway enrichment analysis by overrepresentation analysis for DEGs of stimulated vs. unstimulated monocytes identified 36 relevant KEGG pathways (full list: Supplementary Data 1). False discovery rate (FDR)-corrected p-values are indicated. d Log2 of fold-changes (log2FC) of expression for genes encoding glycolysis and tricarboxylic acid (TCA) cycle enzymes. Significant differential gene expression was detected in at least one condition (marked with X). RNA-sequencing data are accessible through GEO accession number GSE177040. List of all DEGs and full list of enriched KEGG pathways are provided in Supplementary Data 1. Source data are provided as a Source Data file.

