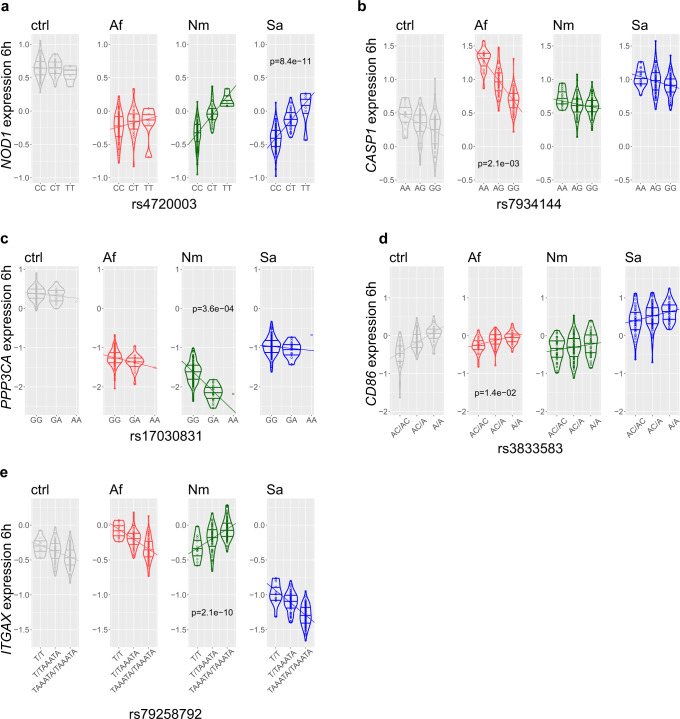
Fig. 3. reQTL-regulated genes that correspond to pattern recognition receptor signaling.
a–d Violin plots with allele-dependent differences in expression of NOD1, CASP1, PPP3CA, and CD86 in A. fumigatus (Af), N. meningitidis (Nm) or S. aureus (Sa) stimulated monocytes following 6 h treatment. Distribution of centralized log2 expression is shown for genotypes of indicated single-nucleotide polymorphisms (SNPs). Dashed lines: regression slope of gene expression values vs. genotype. Dots: individuals for the respective genotype. Horizontal lines in violins indicate 75th percentile, median and 25th percentile from top to bottom. For NOD1 and CD86, only the top SNP for a condition with the strongest p value is shown. e Allele-dependent differences in expression of ITGAX with opposite effect directions after stimulation with N. meningitidis compared to A. fumigatus (pNm-Af = 2.63 × 10⁻¹⁷) and S. aureus (pNm-Sa = 2.33 × 10⁻²²) for 6 h. Bonferroni corrected p-values from z test of differences in regression coefficients to unstimulated control (ctrl) are indicated. Ctrl: unstimulated. Source data are provided as a Source Data file.

