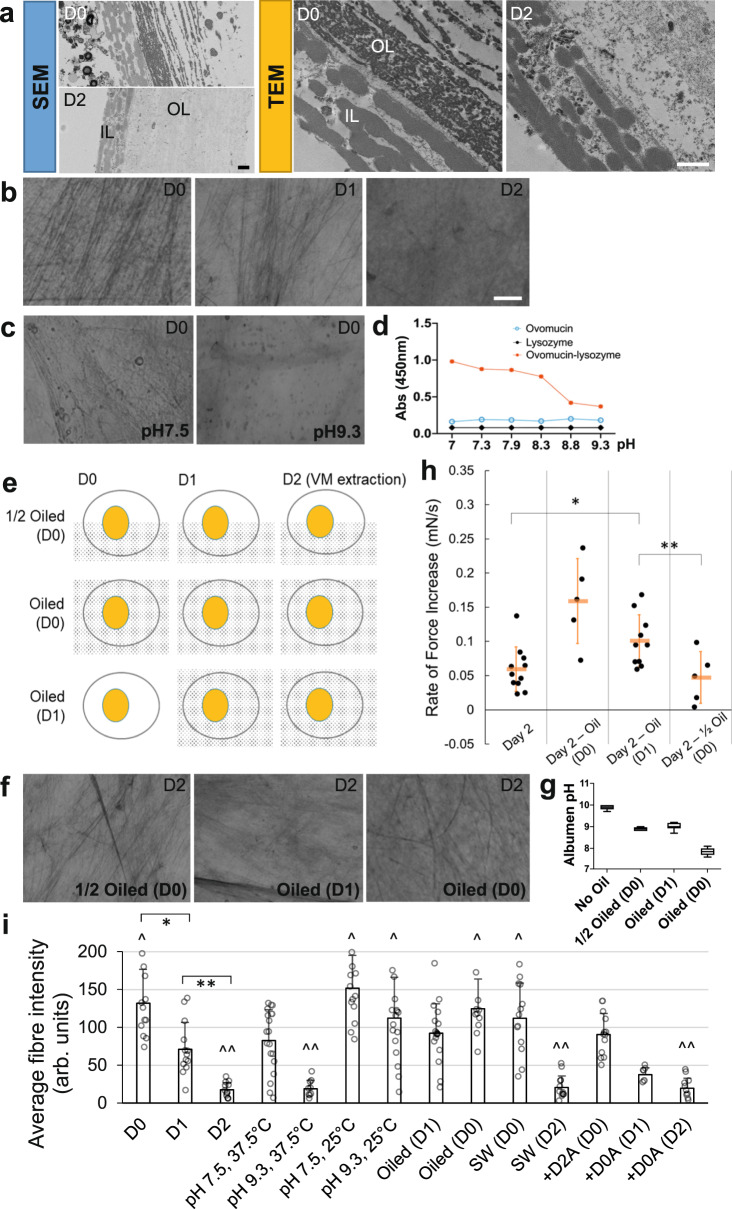
Fig. 5. Biochemical changes in the egg environment control VM mechanics.
a Scanning (SEM) and Transmission (TEM) electron microscope cross-sections of the VM (representative samples). OL outer layer, IL inner layer. Scale bar, 1 μm. b, c, f Glycoprotein fibers on the VM stained by the PAS (Periodic acid–Schiff) method. Top right label shows the incubation time when the VM was extracted. Bottom right label shows perturbations. Oil treatments started from the Day indicated in “()”. pH buffer treatments lasted 12 h. See Supplementary Fig. 3c for additional samples. Scale bar: 10 μm. d Interaction assay between Ovomucin and Lysozyme. Diluted preparations of two components fogged the solution when mixed. The interaction weakened with increasing pH. e Diagram of oil coating experiments. Dotted patterns indicate oil coating. g Albumen pH after oil treatments (n = 8 for each group). The whiskers mark the minimum and maximum measurements. The boxes are 25% to 75%. The lines are the median value. h Stiffness measurements of VMs from oiled eggs. *p = 0.004, **p = 0.022, 2 tailed t-tests. n = 11, 5, 10, 5, respectively. The method and experimental group labeling in the panel follow those of Fig. 1h. i Fibre density of PAS stained VMs. n = 13, 13, 11, 19, 9, 14, 18, 17, 11, 13, 12, 13, 7, 11 random areas were measured in each group of images, respectively. Bars are the mean value and error bars are SD. ^ indicates no group is significantly different from other groups including the D0 control (p = 0.14), ^^ indicates no group is significantly different from other groups including the D2 control (p = 0.96), One-way ANOVA tests; *p = 0.0008 and **p = 9e-5, 2 tailed t-tests. SW, filter sandwich for 6 h; +D2A and +D0A, incubated in D2 and D0 albumen for 24 h.

