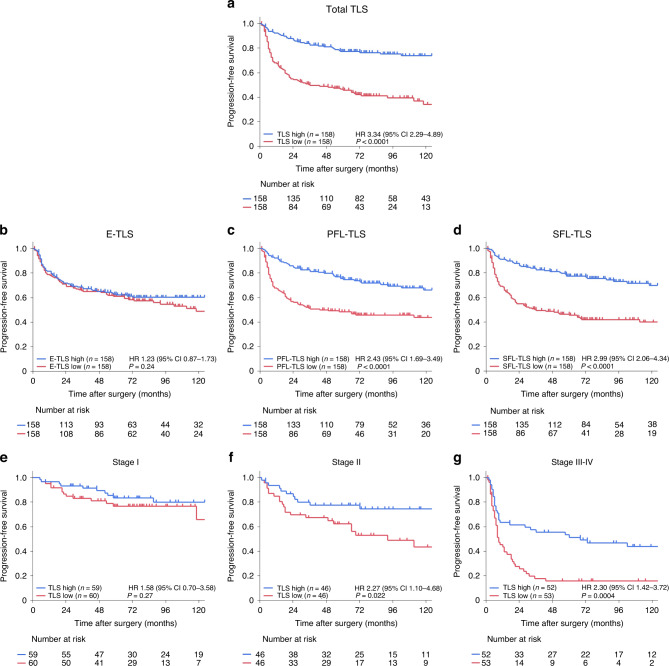
Fig. 2. Survival analysis according to tertiary lymphoid structure (TLS) expression in oesophageal cancer patients.
a–d Kaplan–Meier survival curves for progression-free survival (PFS) in all 316 patients according to the density of total TLSs (a), E-TLSs (b), PFL-TLSs (c), and SFL-TLSs (d). e–g Subgroup analysis of Kaplan–Meier survival curves for PFS according to total TLS density among Stage I (e), Stage II (f) and Stage III–IV (g) patients. Comparisons were made by the log-rank test. The hazard ratio (HR) and 95% confidence intervals were computed by a Cox proportional hazard model.

