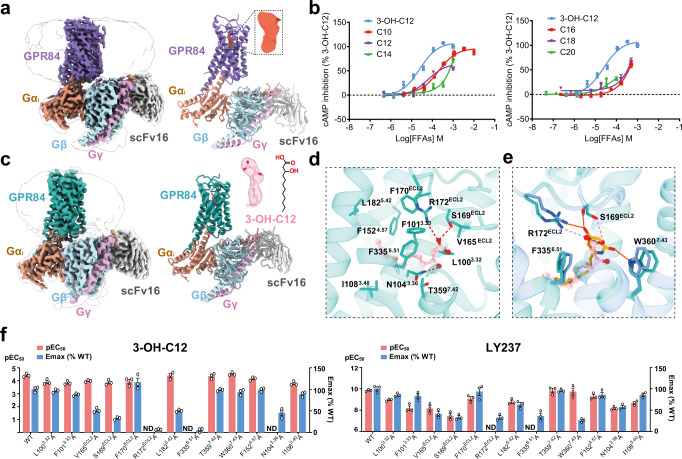
Fig. 3. Identification of the 3-OH-C12 bound GPR84-Gαi complex by cryo-EM.
a Cryo-EM density map (left) and ribbon presentation (right) of the GPR84-Gαi complex without any ligand added, the additional map in the binding pocket is shown on the upper right (tomato). b Dose-response curves of free fatty acids (FFAs) with different chain lengths in inducing GPR84-mediated cAMP inhibition, with 3-OH-C12 as control. Data are shown as mean ± S.E.M. from a minimum of three technical replicates, which performed in triplicates. The representative dose-response curves are shown. C10, decanoic acid; C12, lauric acid; C14, myristic acid; C16, palmitic acid; C18, stearic acid; C20, arachidic acid. c Cryo-EM density map (left) and ribbon presentation (right) of the 3-OH-C12-GPR84-Gαi complex. d Detailed interactions of 3-OH-C12 with residues in the binding pocket of GPR84. e Interaction differences between LY237 (orange solid line) and 3-OH-C12 (pink dotted line) bound to GPR84. f Mutagenesis study to identify the key interaction residues for 3-OH-C12 (left panel) or LY237 (right panel) mediated GPR84 activation with cAMP assay. Values are shown as the mean ± S.E.M. from a minimum of three technical replicates, which performed in triplicates. ND-not determined, indicates that the activation level is too low to determine EC50 values. Numerical data for graphs in f are available as in Supplementary Table 1. Source data are provided as a Source data file.

