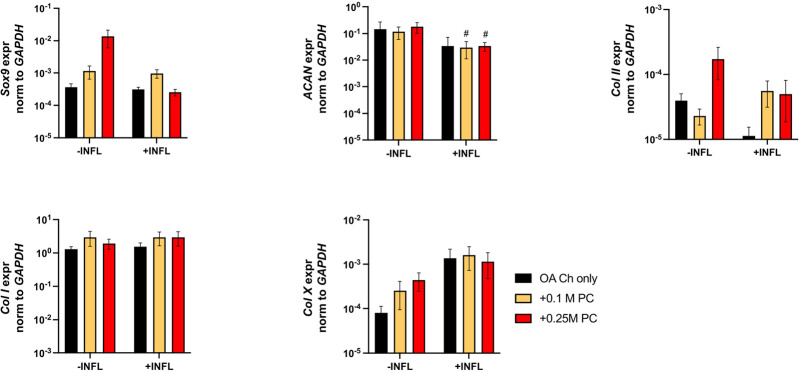
FIGURE 7.
Expression levels of chondrogenic genes in OA chondrocytes after 24 h. Real-time reverse transcriptase–polymerase chain reaction of OA Chondrocytes after 24 h of monoculture (OA Ch only) or co-culture with 0.1 M or 0.25 M ProtheraCytes® (PC)/well (+0.1 M PC and +0.25 M PC, respectively) in the absence (−INFL) or presence (+INFL) of inflammatory cytokines. Values are mean ± SD of measurements from 4 independent experiment with 3 replicates/experiment. Each replicate was analysed in duplicate.

