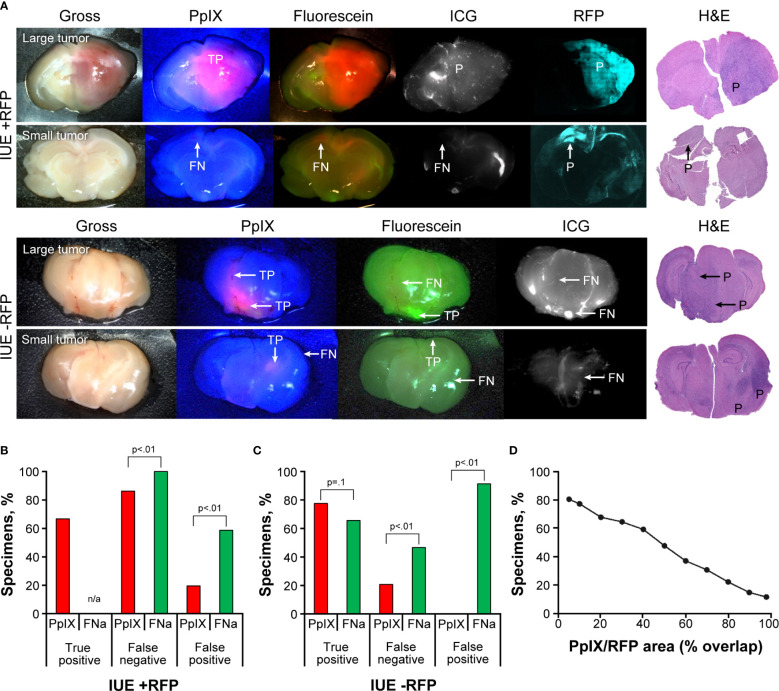
Figure 3.
In utero electroporation glioma model with and without red fluorescence protein (IUE +RFP and IUE -RFP, respectively) visualized using operating microscope with various fluorescent filters. (A) Examples of gross view, protoporphyrin IX (PpIX), fluorescein sodium (FNa), and indocyanine green (ICG) fluorescence. In IUE +RFP tumors, PpIX highlighted the bulk of the tumors; however, the peripheries of large and small tumors were PpIX negative. True-positive (TP), false-negative (FN), and positive (P) findings are indicated where appropriate. (B) Comparison of percentages of TP, FN, and false-positive (FP) areas between PpIX and FNa fluorescence. We were able to calculate the percentage of visualized areas and determine the staining pattern of PpIX in the IUE +RFP model compared with the IUE -RFP model. Strong fluorescence of RFP under YELLOW 560 mode did not permit reliable detection of TP FNa in IUE +RFP tumors; therefore, it was not calculated in this model. However, in small tumors, where bright FP FNa fluorescence of the normal brain areas was obvious and RFP signal was not as bright and did not oversaturate the image, we were able to assess FP and FN FNa percentages. We used RFP fluorescence visualized under confocal microscope and hematoxylin and eosin (H&E)–stained sections as a reference to identify tumor locations. Among 87 IUE +RFP samples (13 animals), 58 (67%) had TP findings, 75 (86%) had FN findings, and 17 (20%) had FP findings of areas of tumor with PpIX fluorescence. Areas of tumor with TP FNa fluorescence were not calculated because of overlapping strong RFP fluorescence. FN areas were observed in 87 (100%) samples, and FP areas were observed in 51 (59%) samples. Significantly fewer FN and FP fluorescent areas were found with PpIX fluorescence than with FNa (both p<0.01). (C) Among 58 IUE -RFP samples (7 animals), 45 (78%) had TP findings, 13 (22%) had FN findings, and 0 (0%) had FP findings with PpIX fluorescence. With FNa fluorescence, 38 (66%) samples had TP findings, 27 (47%) samples had FN findings, and 53 (91%) samples had FP findings. Significantly fewer FN and FP fluorescent areas were observed with PpIX fluorescence than with FNa (both p<0.01). (D) Relation between percentage of specimens and overlap between PpIX and RFP fluorescence. PpIX-positive fluorescence covering 80% of the tumor was observed in only 22% of specimens, 50% overlap was observed in 47% of specimens, and at least 20% overlap was observed in 68% of specimens. Used with permission from Barrow Neurological Institute, Phoenix, Arizona.

