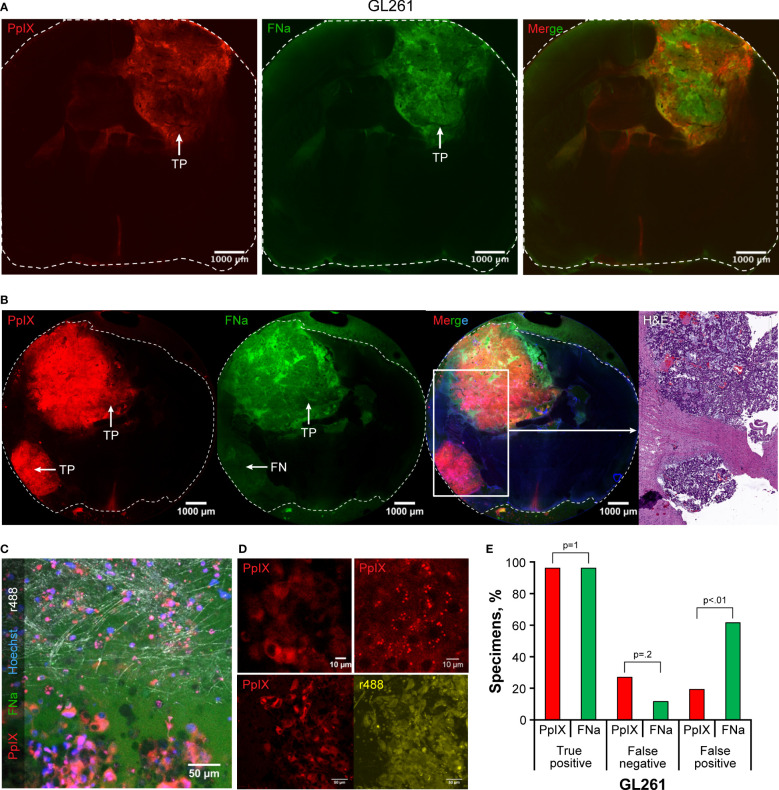
Figure 4.
Confocal imaging of coronal brain slices with GL261 gliomas. (A) Most tumors presented as large uniform mass highlighted equally well by protoporphyrin IX (PpIX) and fluorescein sodium (FNa). (B) In some areas, however, PpIX highlighted tumor areas that were not highlighted by FNa. Presence of the tumor in false-negative (FN) FNa areas is evident in the hematoxylin and eosin (H&E) stain. (C) A confocal image at the tumor border shows large, atypical cells with intracellular PpIX accumulation at the bottom of the image. FNa has typical extracellular distribution, creating shadows of unstained cells. Note sparse PpIX-positive cells in the normal brain at the top of the image. Reflection (r488) shows normal brain axons in white, and Hoechst stain highlights nuclei in blue. (D) GL261 tumor cells have various PpIX staining patterns. Note heterogeneous staining of the cells in the top left image and intracellular granules with PpIX on the top right image. Another field of view at the bottom demonstrates that not all GL261 cells accumulate PpIX and that the degree of accumulation varies. The contours of all cells are shown in reflection r488 mode for reference. (E) Quantitative comparison of the percentages of true-positive (TP), FN, and false-positive (FP) areas between PpIX and FNa fluorescence seen on confocal images. Among 26 GL261 samples (6 animals), 25 (96%) had TP findings, 7 (27%) had FN findings, and 5 (19%) had FP findings with PpIX fluorescence. With FNa fluorescence, 25 (96%) samples had TP findings, 3 (12%) samples had FN findings, and 16 (62%) samples had FP findings. A lower percentage of FP areas was found with PpIX fluorescence than with FNa (p<0.02). Used with permission from Barrow Neurological Institute, Phoenix, Arizona.

