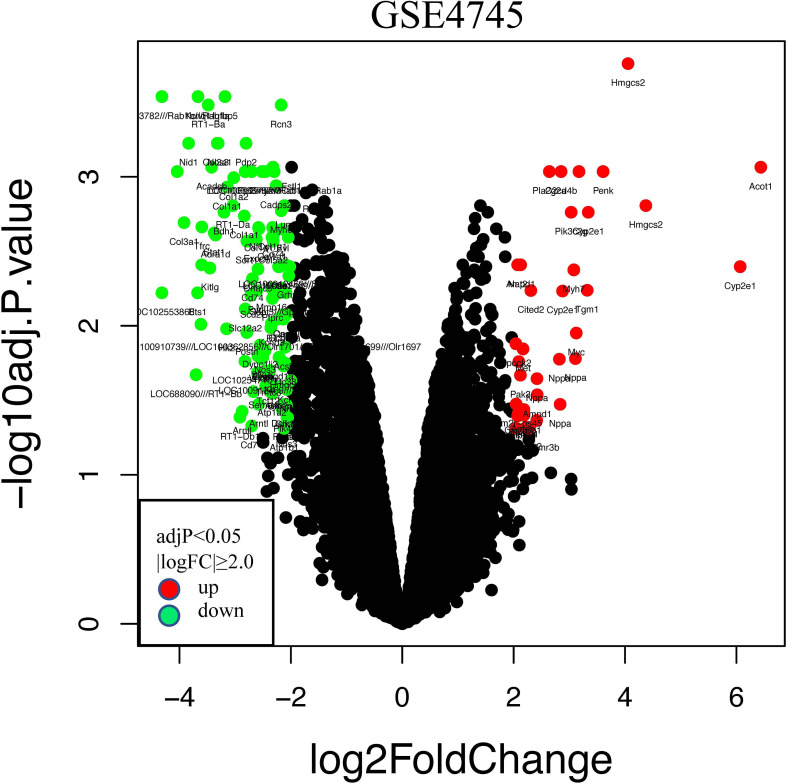
Figure 3.
Volcano plots of differentially expressed genes (DEGs) in the GSE4745 dataset. Red and green plots represent up- and downregulated genes, respectively (|logFC| ≥ 2.0 and adjusted p < 0.05), while black represents no significant difference. FC, fold change.

