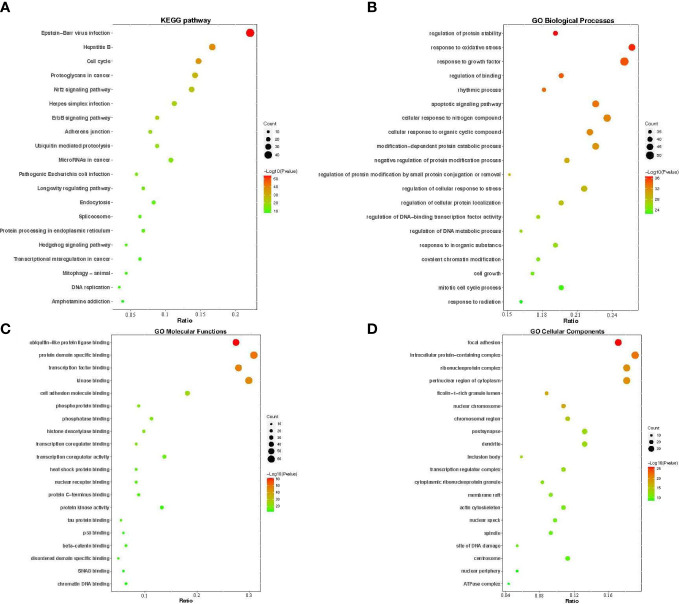
Figure 5.
GO functional annotation and KEGG pathway enrichments. The bubble plots of the 20 most significant signaling pathways based on KEGG enrichment analysis (A), and the top 20 enriched GO terms of biological process (B), molecular function (C), and cellular components (D). The X-axis and Y-axis stand for the gene ratios and full names of the processes, respectively. The color and size of each bubble represent the p-value and gene count, respectively.

