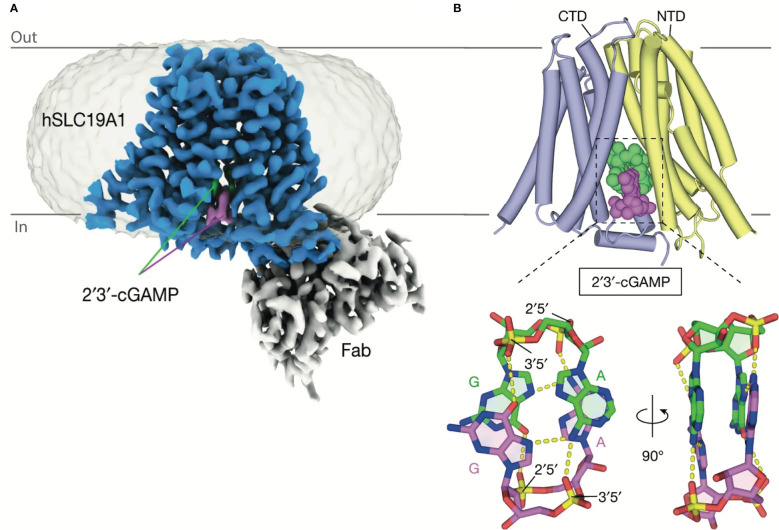
Figure 4.
Structure of SLC19A1 in complex with 2’3’-cGAMP. (A) Cryo-EM density map of human SLC19A1(blue)-Fab(grey) complex bound to two molecules of 2’3’-cGAMP (green and purple). (B) The overall structures of human SLC19A1 bound to 2′3′-cGAMP in the inward-open conformation. The N-terminal domain (NTD) is colored yellow and C-terminal domain (CTD) colored blue. Two bound 2′3′-cGAMP molecules are shown as a space-filling representation and are colored (green and purple). Adapted with permission from Zhang, Zhang (31).

