
FIGURE 2.
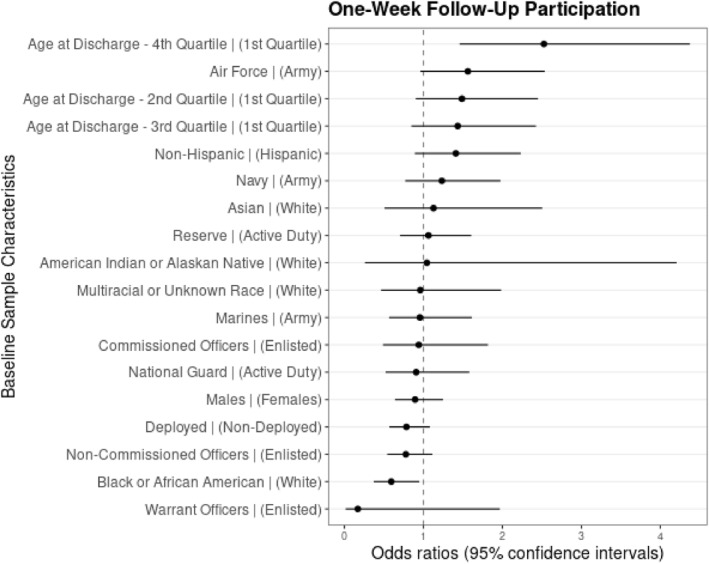
One‐week follow‐up attrition analysis. Plot of odds ratios with 95% confidence intervals for baseline demographic characteristics predicting participation in the 1‐week follow‐up survey. For each predictor, the associated reference group is listed in parentheses. For instance, the second coefficient from the bottom reflects the odds ratio for Black or African American (vs. White) individuals, and indicates that Black or African American participants were significantly less likely to participate in the 1‐week follow‐up than White participants. One case was removed from the analysis, as there was only one individual who identified their race as Native Hawaiian/Pacific Islander in the sample that completed the baseline survey. The total sample size at the 1‐week follow‐up was N = 560