
FIGURE 1.
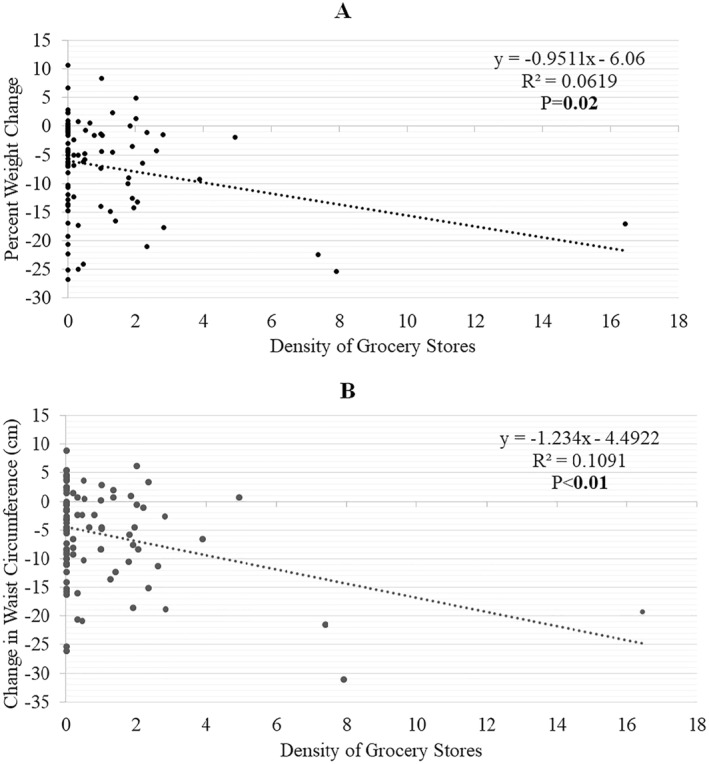
Association between density of grocery stores and changes in (A) percent weight and (B) waist circumference (WC) at 18 months. aResults from simple linear regression. Bold values indicate p‐value < 0.05.
Official websites use .gov
A
.gov website belongs to an official
government organization in the United States.
Secure .gov websites use HTTPS
A lock (
) or https:// means you've safely
connected to the .gov website. Share sensitive
information only on official, secure websites.
Association between density of grocery stores and changes in (A) percent weight and (B) waist circumference (WC) at 18 months. aResults from simple linear regression. Bold values indicate p‐value < 0.05.