FIGURE 1.

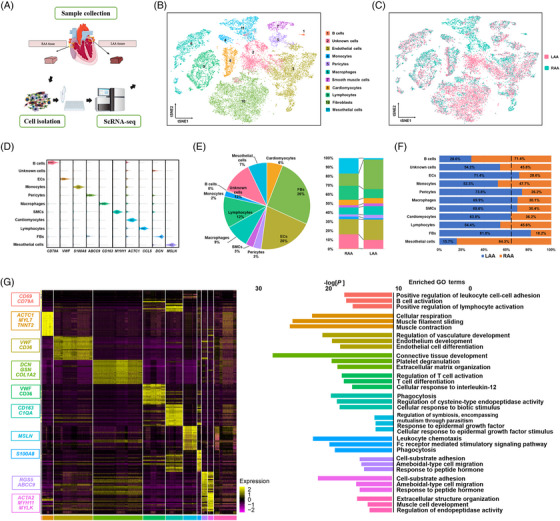
Gene expression and cell atlas of atrial appendage samples from patients with atrial fibrillation. (A) Schematic representation of the single‐cell study process. Samples obtained from the left atrial appendage (LAA) (n = 3) and right atrial appendage (RAA) (n = 3) of three patients were processed using Chromium 10× chemistry and analysed using single‐cell RNA‐sequencing (scRNA‐seq). (B and C) Visualization of t‐distributed stochastic neighbour embedding (t‐SNE) of 32 326 cells and 11 major cardiac cell types. Each dot represents a single cell and is coloured according to the cell type designation (B) and sample source (C). The numbers correspond to cell cluster labels. (D) Violin plots of the expression of specific marker genes in each cell type. (E) Distribution of the identified cells according to cell type (left) and their proportions in the LAA and RAA (right). The colour code is shown in (B). (F) Distribution of each cell type between the LAA and RAA. The dashed vertical line indicates the expected proportions (the total number of LAA cells divided by the total number of cells from all specimens). (G) Left: Heat map showing the 20 most up‐regulated genes in each cell type; cell populations were identified based on the expression of the indicated marker genes. Right: gene ontology (GO) enrichment analysis using all genes that reached an average log2 fold change ≥ 1.2 for the given cell cluster. The top three GO terms are presented for each cluster. CM, cardiomyocyte; EC, endothelial cell; FB, fibroblast; MP, macrophage; SMC, smooth muscle cell.
