FIGURE 2.

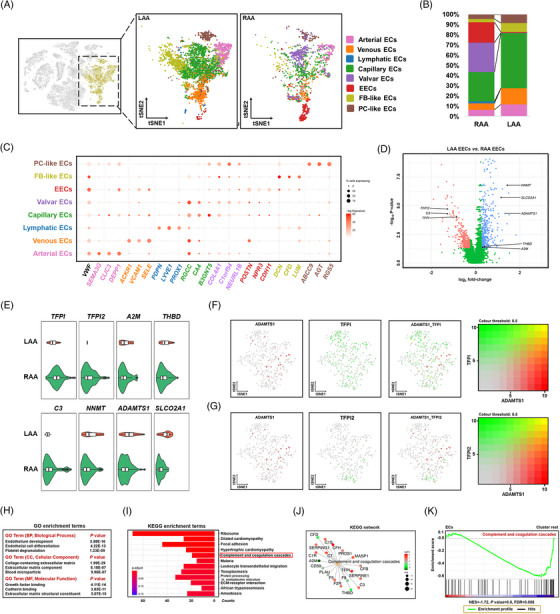
Subpopulations of endothelial cells and characteristics of the atrial appendages of patients with atrial fibrillation (AF). (A) t‐Distributed stochastic neighbour embedding (t‐SNE) plots showing eight endothelial cell (EC) subclusters in the left atrial appendage (LAA) and right atrial appendage (RAA). Each dot represents an individual cell. (B) Proportions of the eight EC subclusters in the LAA and RAA. The colour code is shown in (A). (C) Dot plot shows the percentage of cells that express the indicated marker genes. The size of the dot corresponds to the proportion of cells detected and the intensity of the colour, to the expression (mean log10 p‐value). (D) Volcano plot illustrating differential gene expression in endocardial endothelial cells (EECs) from the LAA and RAA. Genes down‐regulated and up‐regulated in the EECs of the LAA are coloured pink and blue, respectively. (E) Violin plots showing the expression of genes up‐regulated in the RAA (TFPI, TFPI2, A2M and THBD) and LAA (C3, NNMT, ADAMTS1 and SLCO2A1). Boxes indicate the lower and upper quartiles (from left to right), the line within each box indicates the median value, and the whiskers show 1.5× interquartile range (IQR). (F) t‐SNE plots are coloured according to the expression of a disintegrin and metalloproteinase with thrombospondin motifs 1 (ADAMTS1) (red) and tissue factor pathway inhibitor (TFPI) (green) in EECs. (G) t‐SNE plots are coloured according to the expression of ADAMTS1 (red) and tissue factor pathway inhibitor 2 (TFPI2) (green) in the EECs. (H) Top categories of differentially expressed genes (DEGs) up‐regulated in the LAA based on gene ontology (GO) enrichment analysis. (I) Top 10 significant Kyoto Encyclopedia of Genes and Genomes (KEGG) pathways enriched in DEGs up‐regulated in the LAA. The horizontal axis shows the −log10 p‐value. (J) The KEGG network shows 19 genes assigned to the coagulation cascade. The size of the point indicates the total number of genes assigned, and the colour reflects the p‐value correlation. (K) Gene set enrichment analysis (GSEA) results showing the enrichment of EC in complement and coagulation cascades compared to other cell types.
