FIGURE 6.

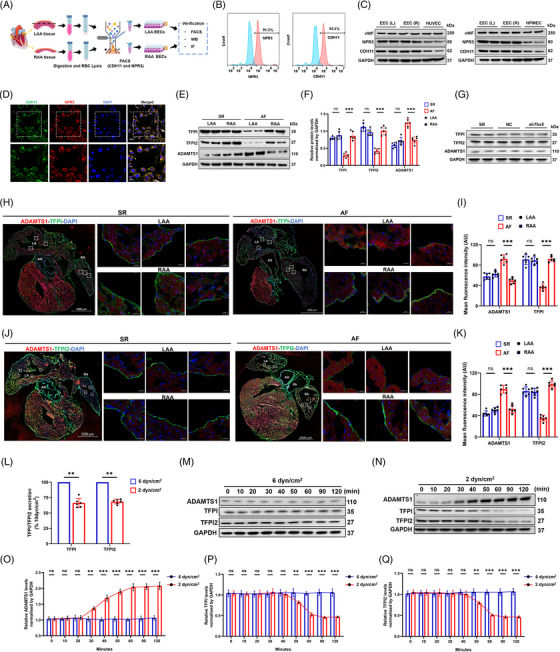
Isolation and localization of endocardial endothelial cells (EECs) for the expression of tissue factor pathway inhibitor (TFPI), tissue factor pathway inhibitor 2 (TFPI2) and a disintegrin and metalloproteinase with thrombospondin motifs 1 (ADAMTS1) in atrial fibrillation (AF) and sinus rhythm (SR) mice. (A) Diagram of digestion, sorting and subsequent verification of EECs isolated from the left atrial appendage (LAA) and right atrial appendage (RAA). (B) FACS data verifying the isolation of EECs with natriuretic peptide receptor 3 (NPR3) and cadherin 11 (CDH11). (C) Western blots (WB) data verifying increased expression of NPR3 and CDH11 in EECs compared to human umbilical vein endothelial cells (HUVECs) (up) and human pulmonary microvascular endothelial cells (HPMECs) (down). (D) Immunostaining data verifying the colocalization of CDH11 (green) and NPR3 (red) in the EECs. (E) WB data showed the expression of TFPI, TFPI2 and ADAMTS1 in the LAA and RAA of AF and SR mice. (F) Quantitative analysis verified that TFPI and TFPI2 decreased, but ADAMTS1 increased in AF of the LAA compared to that of the RAA. (G) TFPI, TFPI2 and ADAMTS1 expression did not change significantly in Tbx5 knockdown cells. (H) Immunostaining for the localization of ADAMTS1 (red) and TFPI (green) in clarified heart sections (scale bar = 1000 μm) and zoomed‐in details (small squares, scale bar = 20 μm) of the LAA and RAA, respectively. (I) The mean fluorescence intensities of ADAMTS1 and TFPI were calculated; ADAMTS1 is higher but TFPI is lower in LAA. (J) Immunostaining for the localization of ADAMTS1 (red) and TFPI2 (green) in clarified heart sections (scale bar = 1000 μm) and zoomed‐in details (small squares, scale bar = 20 μm) of the LAA and RAA, respectively. (K) Mean fluorescence intensities of ADAMTS1 and TFPI2 were calculated; ADAMTS1 is higher but TFPI2 is lower in LAA. (L) Secretion of TFPI and TFPI2 by EECs in medium with 6 or 2 dyn/cm2 shear force exposure. Data were expressed as mean ±eSEM (n = 5). (M) EECs in medium were exposed to a shear stress of 6 dyn/cm2 against low shear stress, and the expression of ADAMTS1, TFPI and TFPI2 was analysed in time series. (N) EECs in medium were exposed to a shear stress of 2 dyn/cm2 against low shear stress, and whole cell lysates were analysed for the expression of ADAMTS1, TFPI and TFPI2 by WB in a time series. (O–Q) The expression of ADAMTS1, TFPI and TFPI2 in (M) and (N) was quantitated after exposure to the indicated shear force. **p < .01. LV, left ventricle; LA, left atrium; RA, right atrium; AO, aorta; AV, aortic valve.
