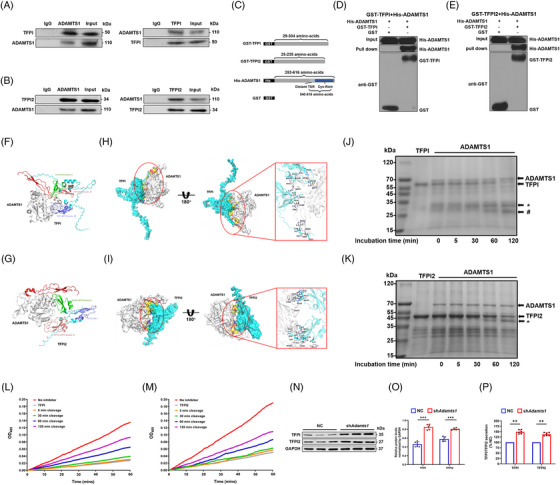
FIGURE 7.

A disintegrin and metalloproteinase with thrombospondin motifs 1 (ADAMTS1) cleaves both tissue factor pathway inhibitor (TFPI) and tissue factor pathway inhibitor 2 (TFPI2) through direct interaction. (A) Interaction between ADAMTS1 and TFPI in endocardial endothelial cells (EECs) of mice by Co‐IP. Mice EECs were subjected to immunoprecipitation (IP) with anti‐TFPI, anti‐ADAMTS1 or anti‐IgG antibodies, followed by western blots (WB) with anti‐TFPI or anti‐ADAMTS1 antibodies. (B) Interaction between ADAMTS1 and TFPI2 in mice EECs by Co‐IP. Mice EECs were subjected to IP with anti‐TFPI2, anti‐ADAMTS1 or anti‐IgG antibodies, followed by WB with anti‐TFPI2 or anti‐ADAMTS1 antibodies. (C) Schematic representation of the fusion proteins used to perform pull‐down and cleavage assays. (D and E) Interaction of ADAMTS1 with TFPI (D) or TFPI2 (E) in vitro by glutathione S‐transferase (GST) pull‐down assays. Blots were evaluated using anti‐His or anti‐GST antibodies, and visible His‐ADAMTS1 bands were detected in pull‐down lanes. Input: whole lysate. (F and G) Schematic visualization of the complexes ADAMTS1‐TFPI (F) and ADAMTS1‐TFPI2 (G). Three‐dimensional structure showing ADAMTS1 (grey) and the TFPI domains (F), including Kunitz I (green), Kunitz II (pink) and Kunitz III (purple), or TFPI2 (G), including Kunitz I (green), Kunitz II (pink) and BPT (purple). (H and I) Selected complex examples of ADAMTS1‐TFPI (H) and ADAMTS1‐TFPI2 (I). Grey ribbons represent ADAMTS1, whereas blue ribbons represent TFPI (H) and TFPI2 (I). A view rotated 180° around the x‐axis is shown with the enlargement of the interacting surface in a red solid box (right). The red and blue spheres represent oxygen and hydrogen atoms, respectively. The interface surface between ADAMTS1 and TFPI (H) and ADAMTS1 and TFPI2 (I) is coloured yellow, and hydrogen bonds are highlighted in black dashed lines. (J) Time course of purified recombinant ADAMTS1 cleavage from purified recombinant TFPI in vitro at 37°C and analysed by Coomassie Blue staining. Full‐length TFPI (56 kDa) and cleavage fragments (32 kDa* and 27 kDa#) are indicated by arrows. (K) Time course of purified recombinant ADAMTS1 (1 μg) cleavage from purified recombinant TFPI2 (1 μg) in vitro at 37°C and analysed by Coomassie Blue staining. Full‐length TFPI2 (49 kDa) and cleavage fragments (42 kDa*) are indicated by arrows. (L) Purified recombinant TFPI2 was incubated in the presence or absence of purified plasma ADAMTS1 for various incubation times, and subsequent FX binding was assessed in an enzyme linked immunosorbent assay (ELISA) setup for 180 min. (M) Purified TFPI2 was incubated in the presence or absence of purified plasma ADAMTS1 for various incubation times, and subsequent FX binding was assessed in an ELISA setup for 180 min. (N) WB analysis of EECs transfected with shAdamts1 RNA or negative control (NC) vector. (O) Quantification of TFPI and TFPI2 after transfection with different plasmids. Data were expressed as mean ± SEM (n = 6). ***p < .001. (P) Secretion of TFPI and TFPI2 by EECs in a medium transfected with shAdamts1 or NC. Data were expressed as mean ±eSEM (n = 6). **p < .01. IB, immunoblotting; Cys, cysteine.
