FIGURE 5.

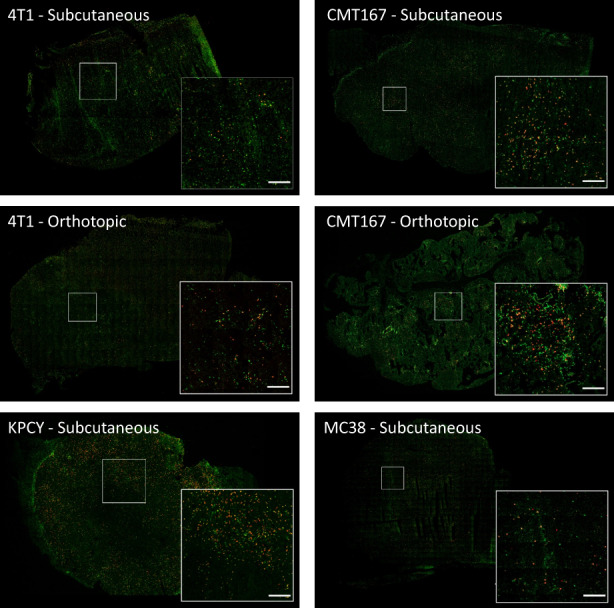
CLSM images showing the distribution of CD3 (green) and CD8 (red) positive T cells in the various tumor models. Scale bars are 200 μm.

CLSM images showing the distribution of CD3 (green) and CD8 (red) positive T cells in the various tumor models. Scale bars are 200 μm.