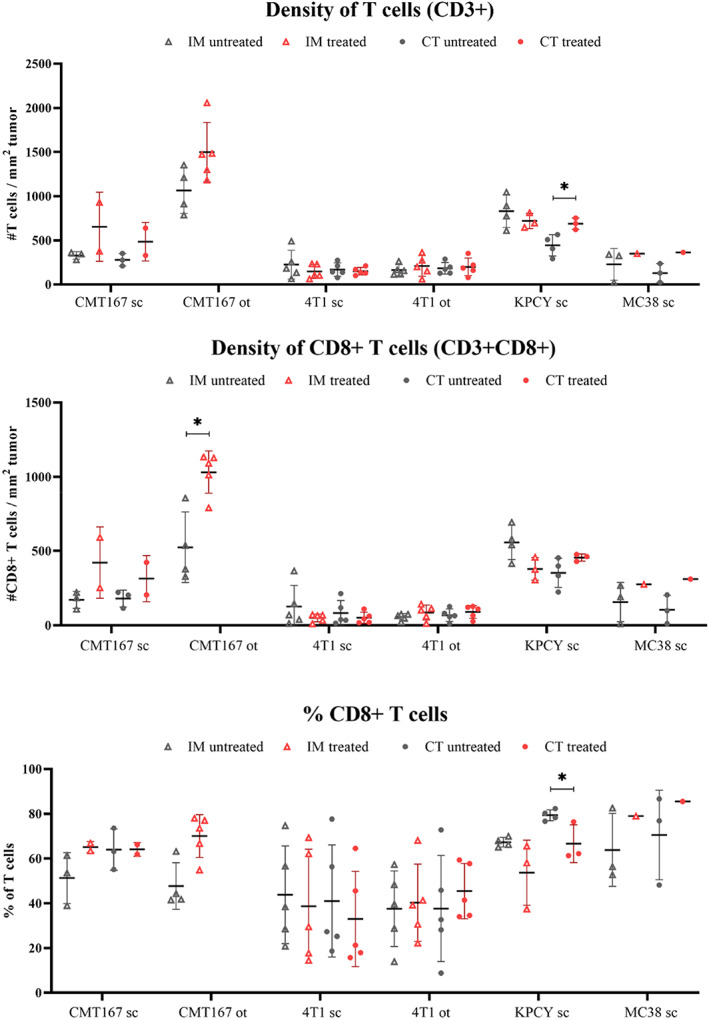
FIGURE 6.

CLSM analysis of the different treated and untreated tumor models displaying the amount of CD8 and CD3 positive cells, in addition to the percentage of CD8 positive cells, in the tumor core (CT) and the invasive margin (IM).

CLSM analysis of the different treated and untreated tumor models displaying the amount of CD8 and CD3 positive cells, in addition to the percentage of CD8 positive cells, in the tumor core (CT) and the invasive margin (IM).