
FIGURE 1.
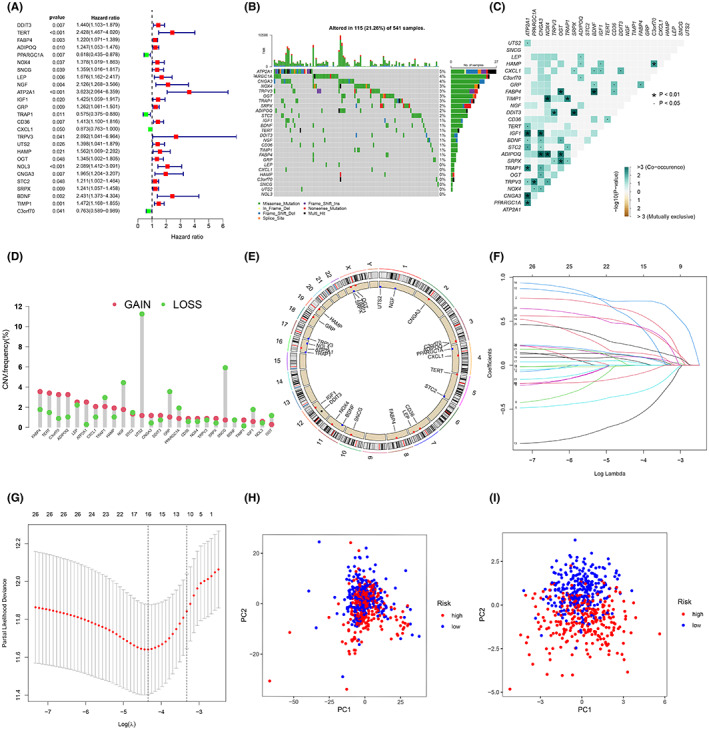
Construction of an ERS risk score model. (A) Sixteen ERSRGs associated with prognosis in patients with CRC. (B) Mutation frequencies in 16 ERSRGs in the training set. (C) Mutation co‐occurrence and exclusion analysis of 16 ERSRGs. (D) Frequency of CNV variants in 16 ERSRGs. (E) The circos plot depicts the location and expression levels of 16 ERSRGs on the chromosome. (F) LASSO coefficients of the 16 ERSRGs. (G) Selection of genes by LASSO Cox regression. (H) Principal component analysis based on all ERSRGs in CRC. (I) Principal component analysis based on ERS risk scores, distinguishing between tumor and normal samples in the training set. Red represents high‐risk patients and blue represents low‐risk patients.