
FIGURE 3.
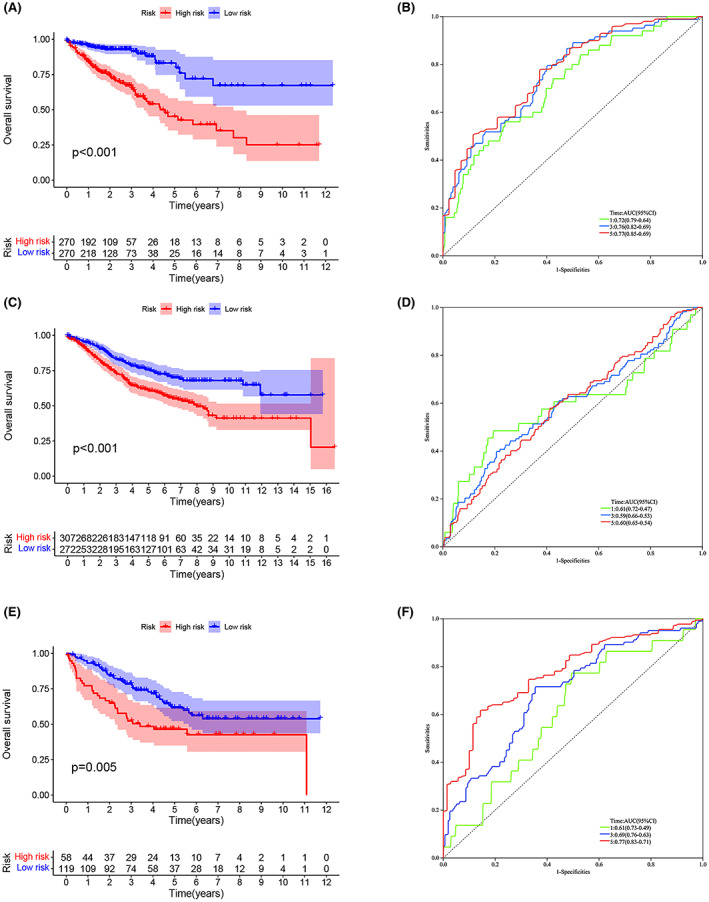
Relationship between the ERS prognostic risk model and clinicopathological features and predictive value for survival. (A) Kaplan–Meier survival curves for the training set. (B) ROC curves for the risk model in the training set. (C) Kaplan–Meier survival curves for the validation set (GSE40967). (D) ROC curves for the risk model in the validation set (GSE40967). (E) Kaplan–Meier survival curves for the validation set (GSE17538). (F) ROC curves for the risk model in the validation set (GSE17538).