
FIGURE 6.
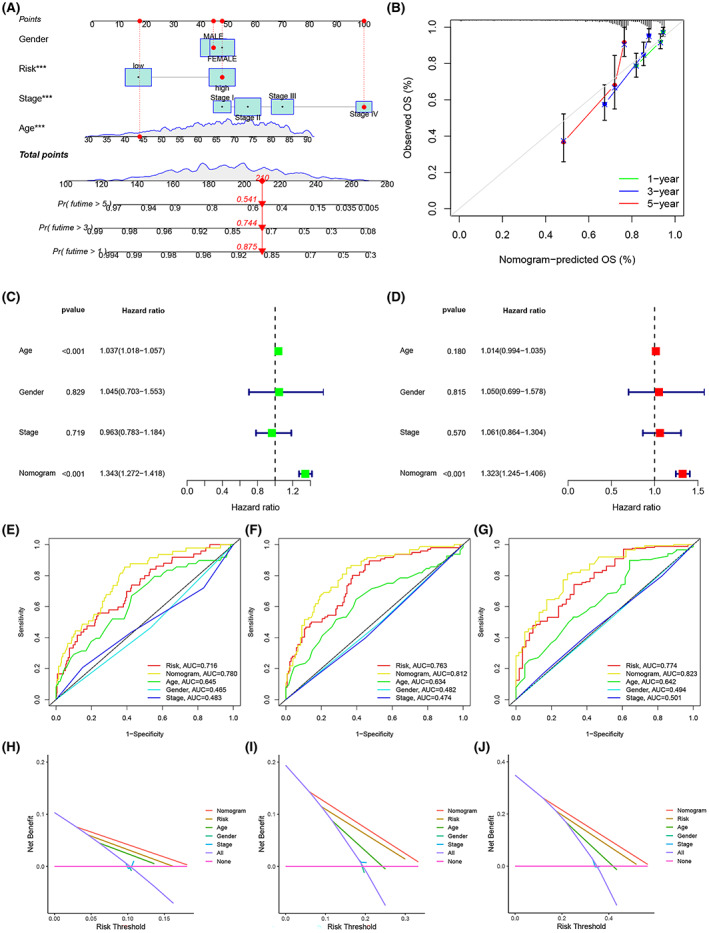
A nomogram to predict CRC prognosis was created by integrating ERS risk scores and clinicopathological features from the training set. (A) Nomogram for predicting the OS of patients in the training set. (B) Calibration chart for the nomogram. (C, D) Forest plots for univariate and multivariate Cox regression analysis of the training set. (E‐G) ROC curves for ERS risk scores and clinicopathological characteristics at 1‐ (E), 3‐ (F), and 5‐ (G) year. (H–J) DCA of the nomogram for 1‐ (H), 3‐ (I), and 5‐ (J) year OS in the training set.