
FIGURE 9.
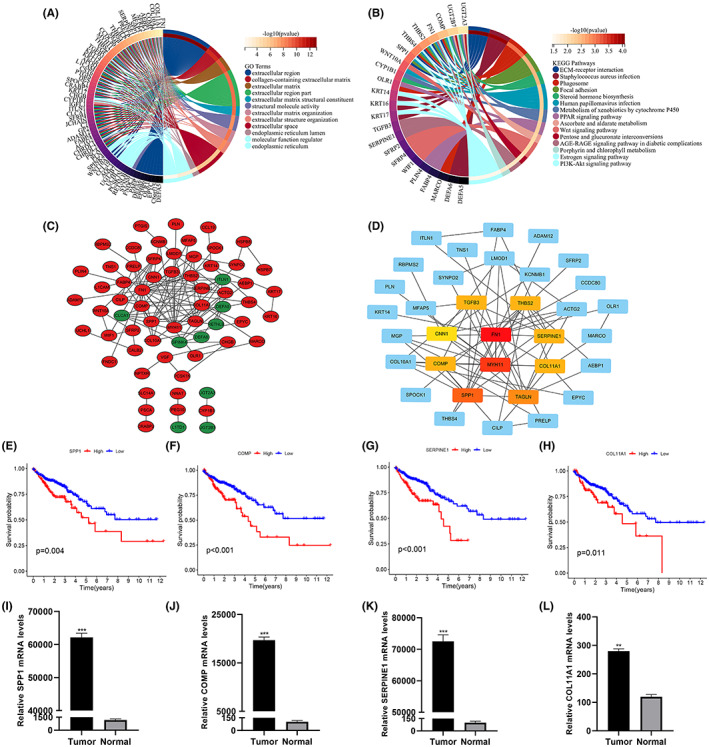
Visualization of the PPI network. (A, B) Circle diagram for GO and KEGG analysis. (C) PPI network processed by Cytoscape. Red represents DEGs expressing up‐regulation. blue represents DEGs expressing down‐regulation. (D) Top 10 hub genes selected by cytoHubba. (E–H) Survival analysis of SPP1(E), COMP(F), SERPINE1(G) and COL11A1(H). (I–L) qRT‐PCR analysis to validate the expression of SPP1(I), COMP(J), SERPINE1(K), and COL11A1(L) in normal and tumor tissues.