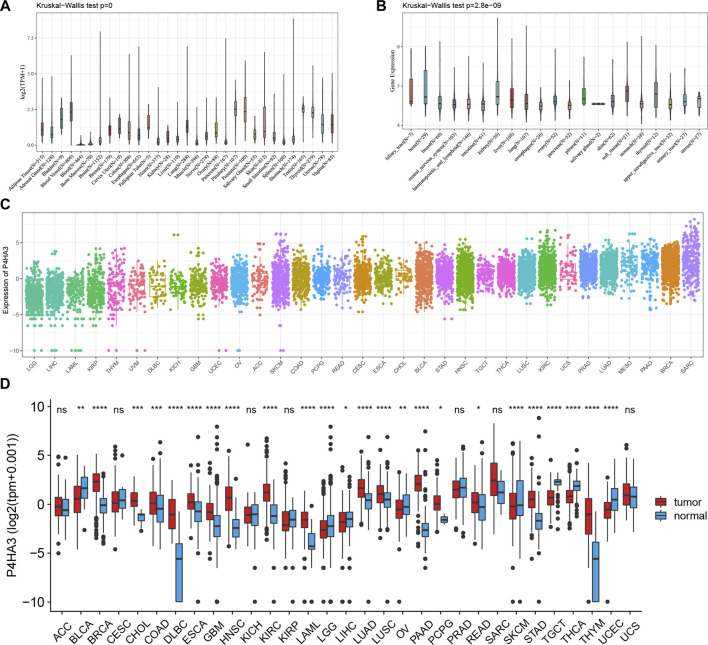
FIGURE 1.
Expression of P4HA3 in normal and tumor tissues. (A) P4HA3 expression across 31 regular tissues and (B) 21 tumor cell lines. The mRNA expression landscape of P4HA3 in (C) tumor tissue on TCGA database and (D) expression of P4HA3 in normal and tumor tissues (*p < 0.05, **p < 0.01, and ***p < 0.001; ns: no significance). p values were based on the Wilcoxon rank sum test.

