
Figure 2.
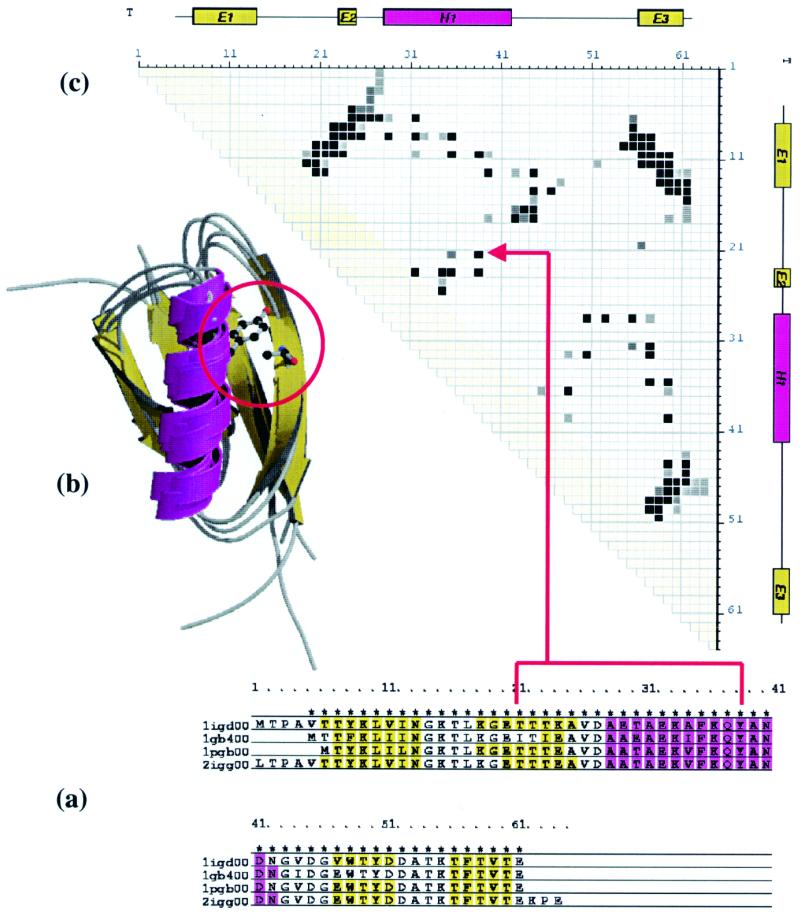
Three representations of consensus data for the homologous family 3.10.20.10 in the CATH database. An example of a totally conserved contact between residues in position 21 and 38 in the alignment is highlighted in each representation. (a) Multiple structural alignment for the family with areas of secondary structure highlighted in purple for α-helices, yellow for β-strands. (b) Superposition of the four structures in the homologous family generated using Molscript (24) and RASTER-3D (25). (c) Consensus contact map describing the inter-residue distances between all positions in the alignment with contact intensity as a function of conservation. Consensus secondary structure assignments are plotted along both axes of the contact map.