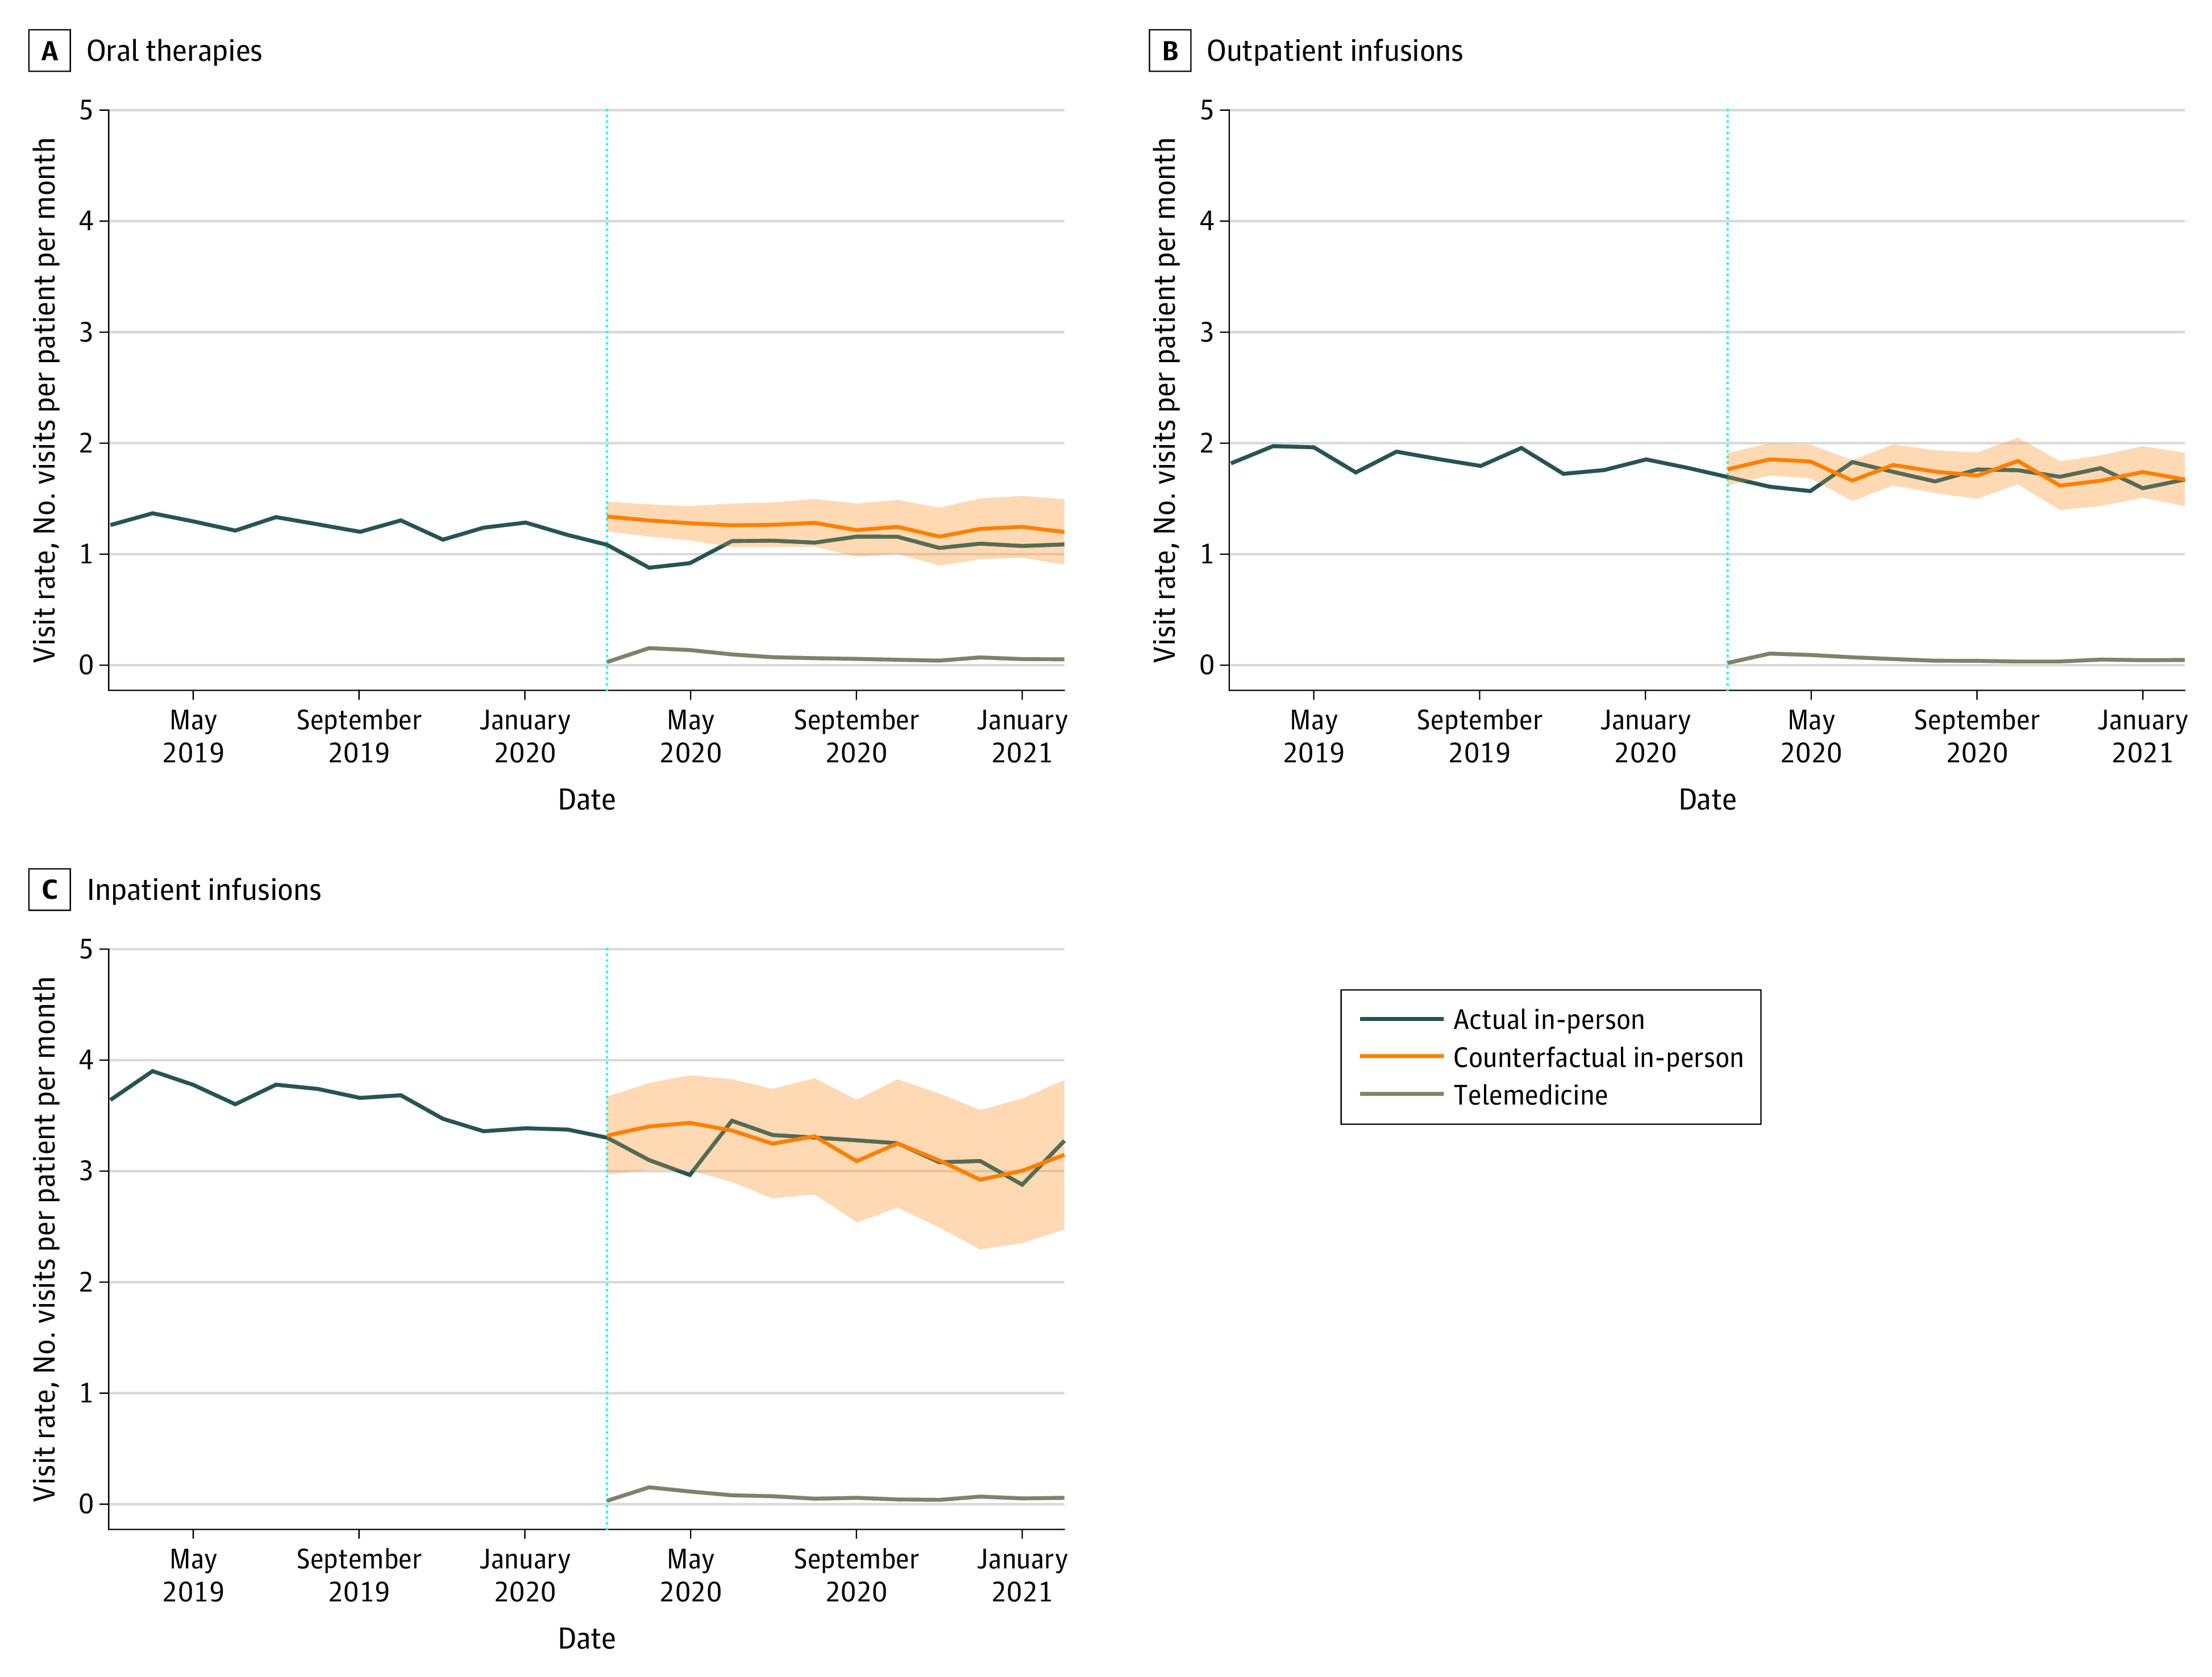
Figure 2. Visit Rates by Treatment Type During the Prepandemic (March 2019 to February 2020) and Pandemic (March 2020 to February 2021) Periods.

A to C, Actual in-person, forecasted (counterfactual) in-person, and telemedicine visit rates for oral therapies (A), outpatient infusion treatments (B), and inpatient infusion treatments (C). The vertical blue dotted lines indicate the onset of the COVID-19 pandemic; shaded areas indicate the 95% prediction interval.
