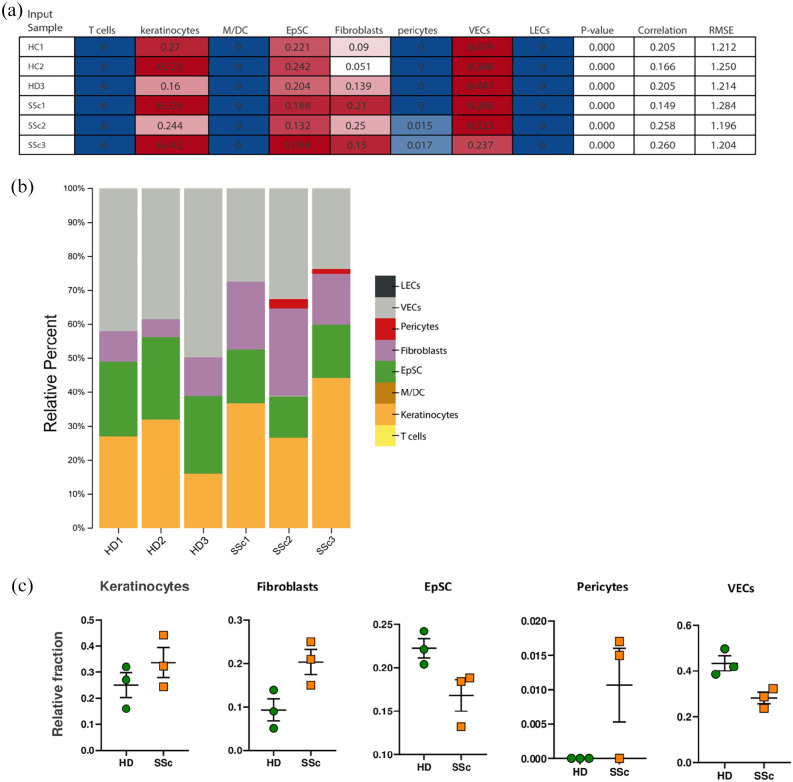
Figure 4.
Cell subsets according to the CIBERSORTx algorithm: (a) cell types expressing DEGs obtained by RNA-seq. Columns represent the cell types from the signature genes file and rows represent deconvolution results for each mixture sample. All results are reported as relative fractions normalized to 1 across all cell subsets. M/DC, macrophages/dendritic cells; EpSC, epithelial stem cells; VECs, vascular endothelial cells; LECs, lymphatic endothelial cells; p value, statistical significance of the deconvolution result across all cell subsets; correlation, Pearson’s correlation coefficient (R), generated from comparing the original mixture with the estimated mixture; RMSE, root mean squared error between the original mixture and the imputed mixture. (b) Bar chart showing the relative percentage (relative fractions × 100) of each cell type computed by CIBERSORTx. (c) Dotplots show the computed relative cellular fractions reported in A.

