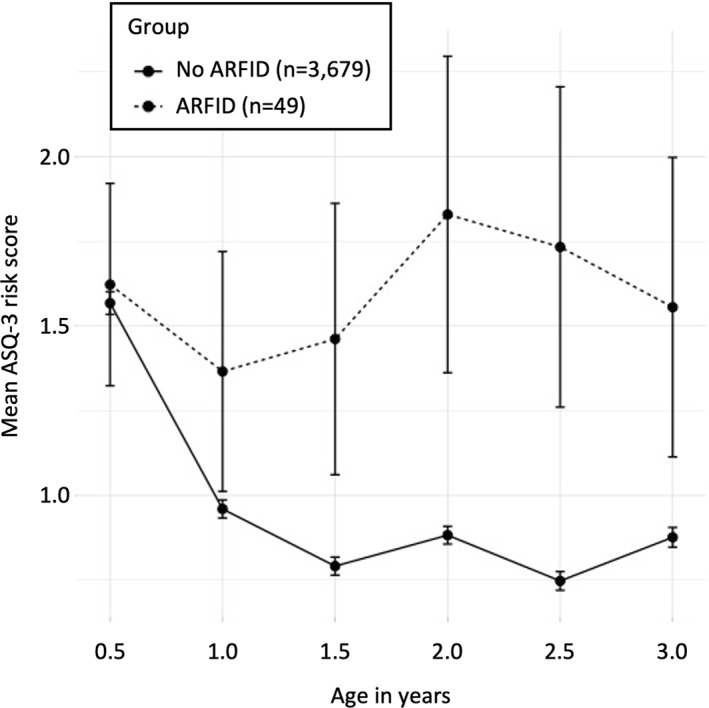
FIGURE 2.

Ages and Stages Questionnaire (ASQ‐3) risk score across age by ARFID group. The x‐axis represents age in years. The y‐axis represents the mean ASQ‐3 risk score in the ARFID group (dashed line) versus the no‐ARFID group (solid line) with a theoretical range of 0–10 points per measurement point (below the monitoring cut‐off on an ASQ‐3 domain: 1 risk point; below the referral cut‐off on an ASQ‐3 domain: 2 risk points; aggregated over the five ASQ‐3 domains). Error bars represent the standard error of the mean
