
FIGURE 1.
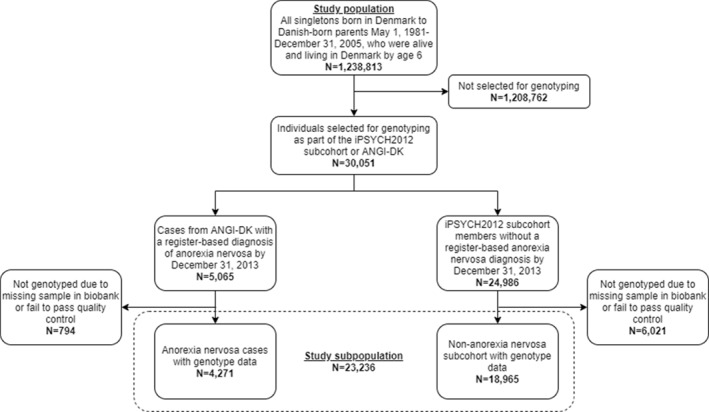
Flowchart depicting the inclusion of individuals in the study population and in the study subpopulation
Official websites use .gov
A
.gov website belongs to an official
government organization in the United States.
Secure .gov websites use HTTPS
A lock (
) or https:// means you've safely
connected to the .gov website. Share sensitive
information only on official, secure websites.
Flowchart depicting the inclusion of individuals in the study population and in the study subpopulation