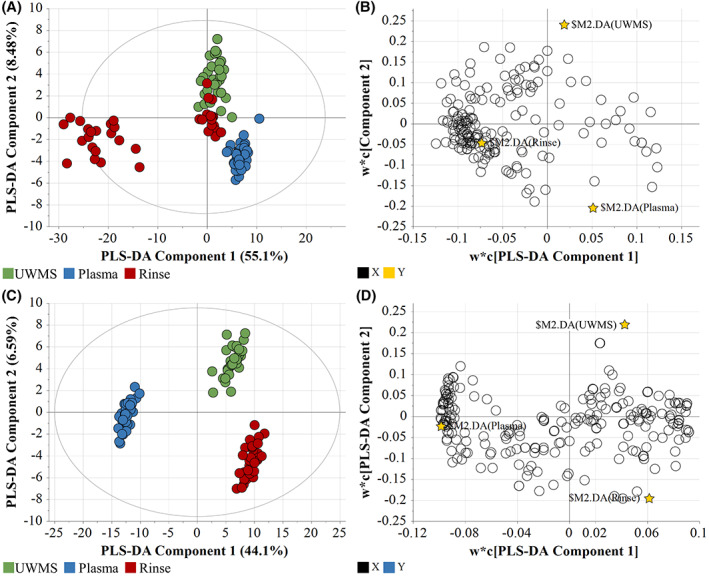
FIGURE 1.

PLS‐DA dataset for the metabolic and lipidomic profiles across all samples of glioblastoma patients. (A) Spread of metabolite samples indicated by score scatter plot, with ellipse representing 95% confidence interval, and (B) Spread of metabolites concerning the groups, indicated by the loading scatter plot. N = 125, R 2 X = 0.802; R 2 Y = 0.956; R 2 = 0.892. (C) Spread of lipid samples indicated by score scatter plot, with ellipse representing 95% confidence interval, and (D) Spread of lipids concerning the groups, indicated by the loading scatter plot. N = 125, R 2 X = 0.58; R 2 Y = 0.9825; R 2 = 0.948.
