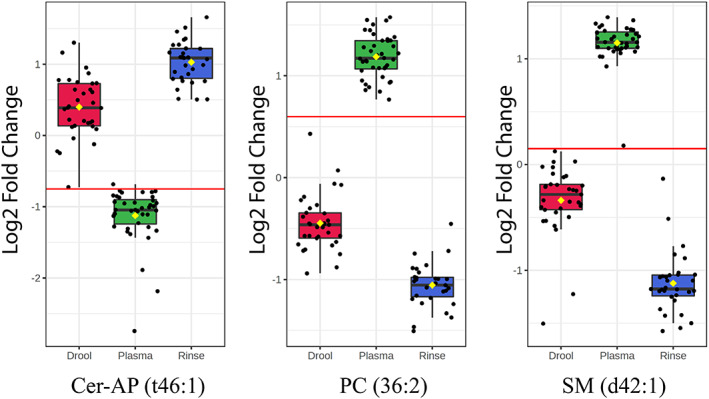
FIGURE 3.

Key representatives of ceramide, phosphatidylcholine and sphingomyelin lipids demonstrate the behaviour of those lipid sub‐classes across UWMS, oral rinse and plasma of glioblastoma patients. Note: The horizontal red line indicates the threshold cut‐off for the true positive rate (sensitivity) of the metabolite within the 95% confidence interval. Cer, ceramides; PC, phosphatidylcholines; SM, sphingomyelins.
