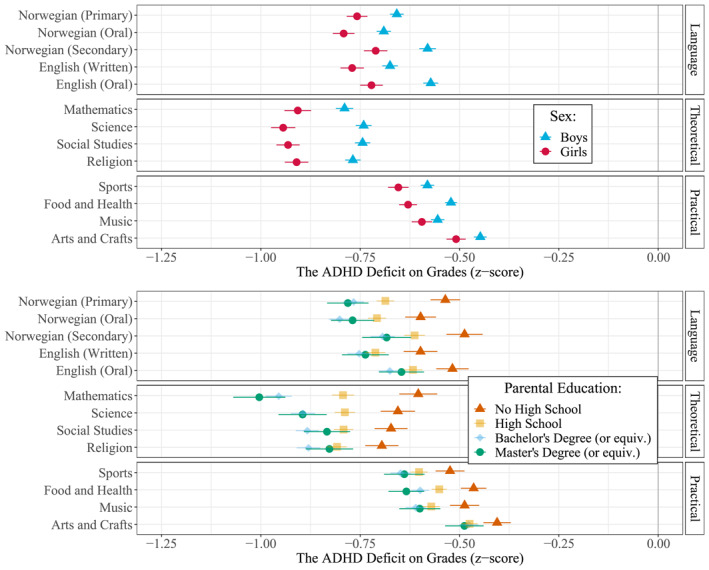
FIGURE 3.

Coefficients (with 95% CIs) showing the relative Attention‐Deficit Hyperactivity Disorder (ADHD) deficit on grades in specific subjects (z‐scores) stratified by sex (top) and parental education (bottom). All coefficients are adjusted for birth year, parity, and birth month, in addition to parental education (top) and sex (bottom)
