
FIGURE 1.
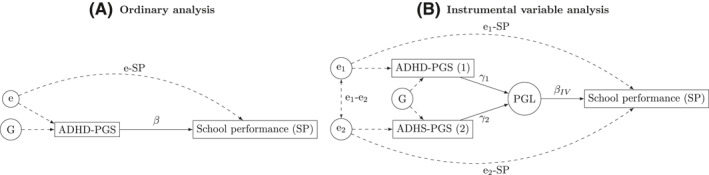
Linear and instrumental variable regression analyses of the association between polygenic scores and school performance. Rectangles represent measured variables, and circles unobserved. Filled lines represent associations possible to estimate using the data available in the current study. Dashed lines represent unobserved associations. (A) Ordinary analysis using either polygenic score (1 or 2). (B) Instrumental variable analysis using both polygenic scores. e, unmeasured influences on PGS and school performance; G, genetic factors; PGL, polygenic load; PGS, polygenic score