FIGURE 4.

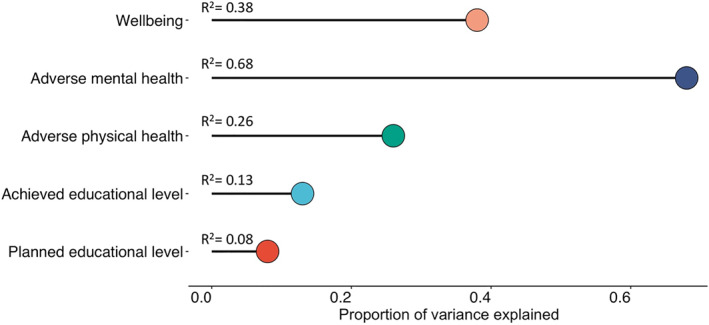
Summary of multiple regression analyses: variance explained (adjusted R 2) in composite scores of adverse physical health, adverse mental health, wellbeing and educational attainment psychological traits

Summary of multiple regression analyses: variance explained (adjusted R 2) in composite scores of adverse physical health, adverse mental health, wellbeing and educational attainment psychological traits