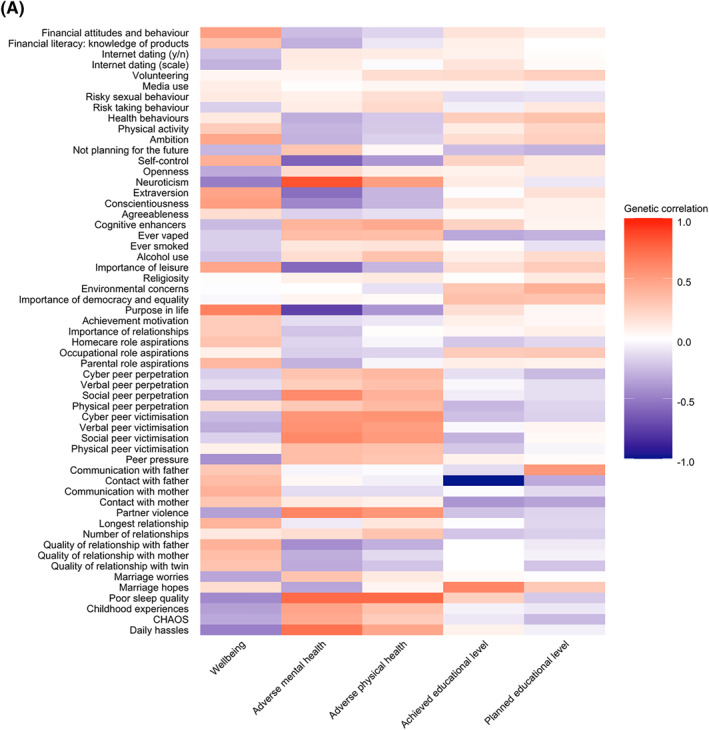
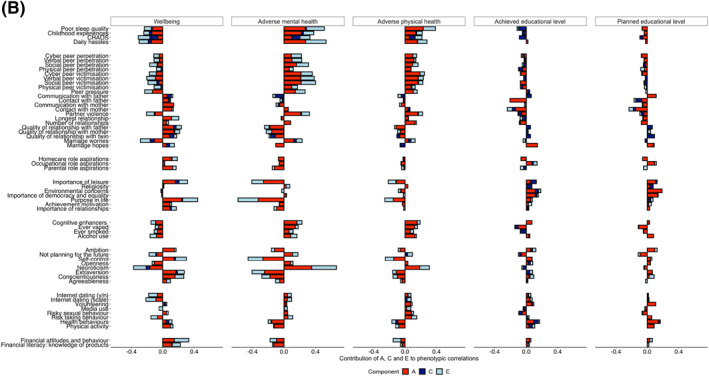
FIGURE 6.
(A) Genetic correlations between EA traits and outcomes derived from bivariate twin analyses; (B) phenotypic correlations between EA traits and key outcomes (indicated by the total length of the bar). Proportion of each correlation explained by additive genetic (A), shared environmental (C) and non‐shared environmental factors are indicated by the red, dark blue and light blue bars, respectively