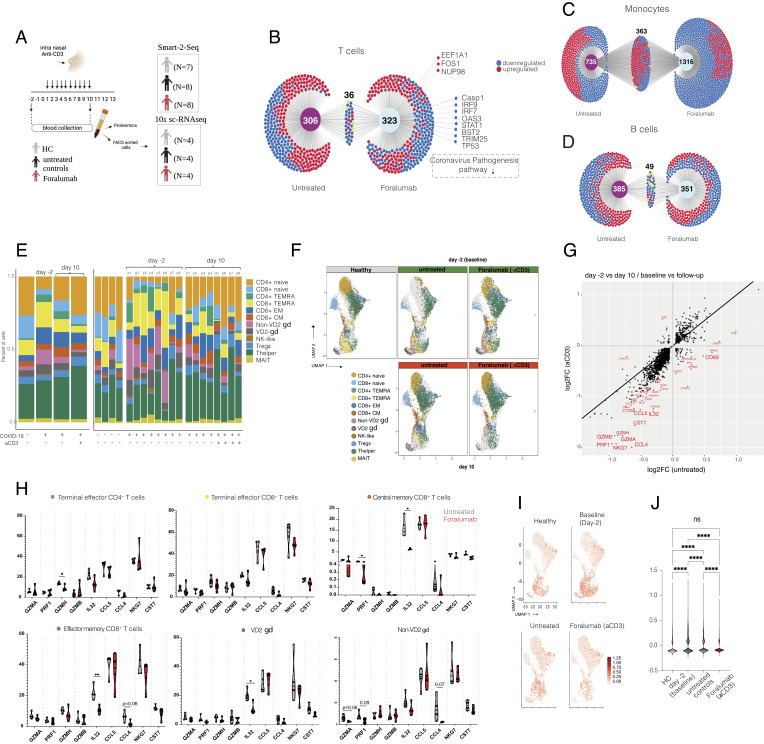
Fig. 1.
Compositional Analysis Shows Reduction of Effector T Cell Subsets in Foralumab-Treated subjects. Study design. Subjects were treated with 100 µg of nasal Foralumab given daily for 10 consecutive days. Blood was collected on day -2 and day 10. For bulk RNA-seq, CD3+, CD19+, and CD14+ cells were FACS-sorted from seven healthy volunteers, eight untreated controls, and eight Foralumab-treated subjects were studied (B-D). For 10× single cell RNA-seq CD3+ cells were FACS-sorted from four healthy volunteers, four untreated controls, and four Foralumab-treated subjects (E–J). (B-D) DiVenn* Diagram shows differently expressed genes that were uniquely expressed in untreated subjects vs. Foralumab-treated subjects found in bulk-RNA-seq. Genes that were common between the groups are also shown. Red dots represent upregulated genes; blue dots represent downregulated genes. Differently expressed genes in T cell (B), monocytes (C) and B cells (D). (E) CD3+ cell subset distribution in healthy controls, untreated and Foralumab-treated COVID-19 subjects at baseline (day -2) and at day 10 identified by 10x sc RNA-seq. (F) Graph-based clustering of uniform manifold approximation and projection (UMAP) of T cell subsets at baseline (day -2) and at day 10 in healthy controls, untreated and Foralumab-treated COVID-19 subjects showing effector T cell cluster decrease in treated subjects. (G) Scatterplot of differentially expressed genes (DEGs) comparison between untreated controls and Foralumab-treated subjects at baseline (day-2) vs. follow-up (day 10). DEG lists from groups were crossed referenced and those above log2 fold change of 0.5 and below log2 fold change of −0.5 are labeled red. (H) Percentage of CD4+ and CD8+ TEMRAs, CD8+ CM, CD8+ EM, non-VD2 gamma delta (gd) and VD2 gd T cells expressing GZMA,PRF1GZMH,GZMBI,L32,CCL5,CCL4,NKG7, and CST7. Violin plots are median ± IQR. Student’s t test was used for comparison of untreated vs. Foralumab for each gene. (I) UMAP plots showing distribution of exhaustion-related genes LAG3,TIGIT,PDCD1CTLA4,HAVCR2, and TOX. (J) Exhaustion scores in each group.

