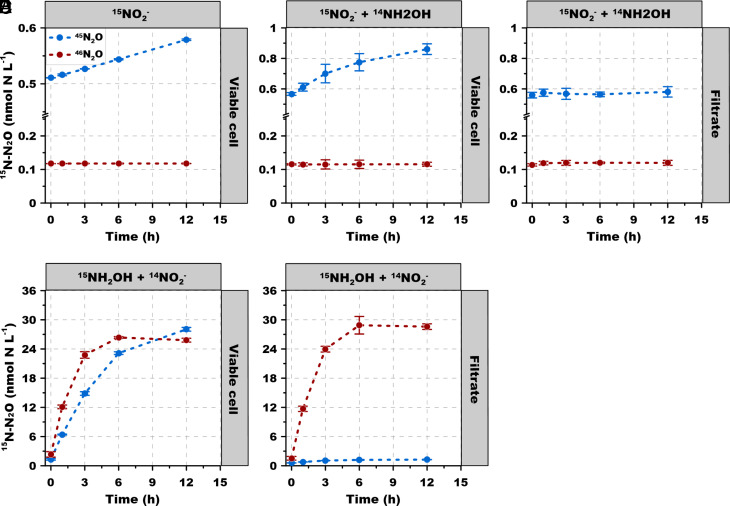
Fig. 5.
Experiment 4. 15N-N2O production from NH2OH. l5N labeled N2O production rate from (A) viable cells with 15NO2− tracer (10 μmol L−1); (B) viable cells with 15NO2− (10 μmol L−1) + 14NH2OH (1 μmol L−1); (C) filtrate with 15NO2− (10 μmol L−1) + 14NH2OH (1 μmol L−1); (D) viable cells with 15NH2OH (1 μmol L−1) + 14NO2− (50 μmol L−1); (E) filtrate with 15NH2OH (1 μmol L−1) + 14NO2− (50 μmol L−1). Error bars represent SD from triplicate samples.

