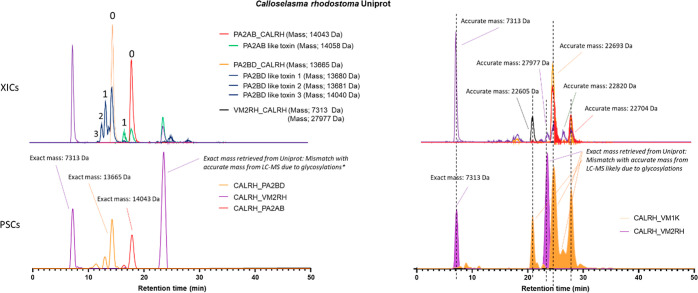
Figure 5.
Detection of multiple PSC peaks from Calloselasma rhodostoma venom corresponding to a single protein accession. Bottom Graphs (C,D) show PSCs of venom toxins PA2BD (Phospholipase A2), PA2AB (PLA2), and VM2RH (snake venom metalloproteinase). Upper graphs (A,B) show XICs and their accurate masses correlating to the PSCs. In graph C, toxin VM2RH shows two peaks of which one corresponds to the disintegrin rhodostomin from which the exact mass can be exactly matched to an accurate mass in the MS (graph A), contrary to its SVMP rhodostoxin from which the exact mass cannot be determined due to its exact glycosylations being unknown. In graph C, toxin PA2BD displays three peaks of which the largest peak can be exactly correlated to the correct accurate mass (0) in graph A. The other PSC peaks corresponding to toxin PA2BD correlate to other accurate masses (1,2,3) shown in graph A. This could be due to PTMs or sequence similarities in different toxins present that are not yet known in the database and therefore are recognized to their closest homologue (PA2BD). In graph C toxin PA2AB displays two peaks from which the largest peak can be exactly correlated to the correct accurate mass (0) in graph A. The other PSC peak corresponding to toxin PA2AB correlates to the other accurate mass (1) shown in graph A. This could be due to PTMs or sequence similarities in the other toxin present that is not yet known in the database and therefore is recognized to its closest homologue (PA2AB). Graph D shows PSCs from SVMPs VM2RH and VM1K with multiple peaks. The two VM2RH peaks can be explained by one that corresponds to its disintegrin rhodostomin and the other to the SVMP rhodostoxin. For VM1K, there are multiple peaks present that correlate to different accurate masses, which are most likely different toxins with sequence similarities but are not yet known in the database and therefore are recognized to their closest homologue (VM1K).

