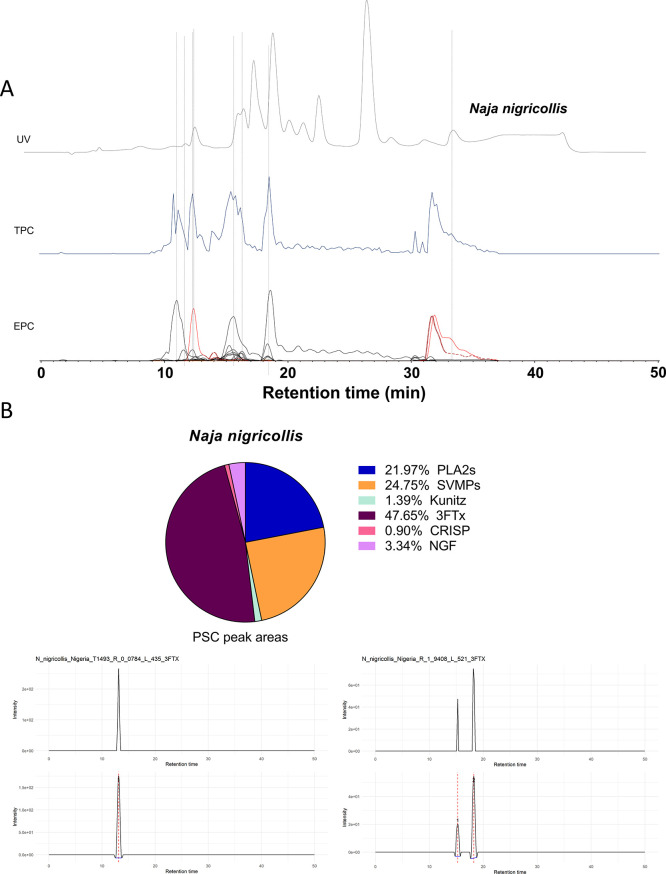
Figure 6.
Proteomics analysis and venom composition analysis by PSC peak integration of Naja nigricollis. (A) Superimposed data of UV, TPC, and EPC data from the Naja nigricollis venom used to correlate UV observed peaks to toxins identified by proteomics. (B) Pie chart of the venom composition of Naja nigricollis based on the PSC peak areas of the identified proteins and their respective toxin families. In addition, two examples of PSC peak integration are shown to illustrate the integration process of the script.

