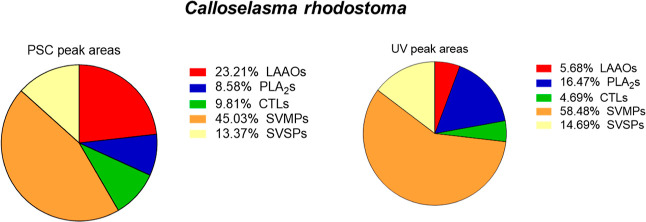
Figure 7.
Comparison PSC peak areas and UV peak areas as means for semiquantitation for the venom composition of Calloselasma rhodostoma. The two pie charts show the venom composition based on the integrated PSC and UV peak areas and for each of the found proteins and their respective toxin classes. Comparable results were obtained for both methods regarding the SVSPs (snake venom serine protease) and SVMPs, while more deviation was observed for the LAAOS, PLA2s, and CTLs (C-type lectins).

