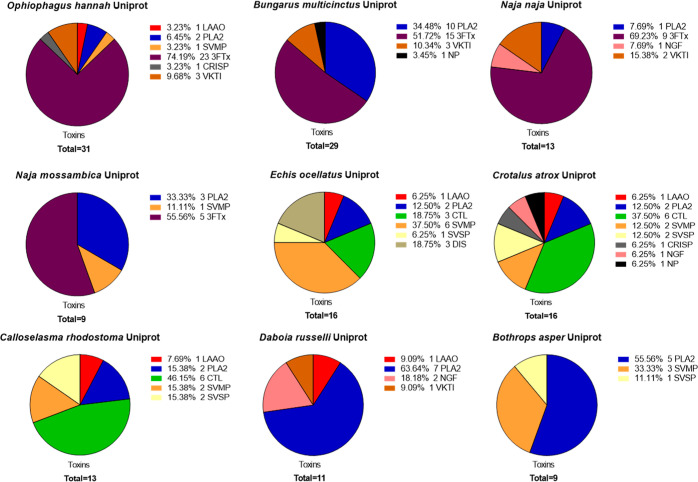
Figure 9.
Pie charts of venom composition derived from medically relevant snake species obtained through high-throughput venomics analysis. After the proteomics data are obtained and processed into PSCs, as described in the Materials and Methods, the number of toxins and their respective toxin families were compiled into summary pie charts. The proteomics results obtained through the Uniprot database were used rather than the transcriptomic databases due to the absence of transcriptomic databases for several snake species. In addition, the results of Naja nigricollis and Naja pallida are not shown here due to a limited number of toxins present in the Uniprot database (two and three, respectively; though see Supporting Information document 1 Section 7 for details).

