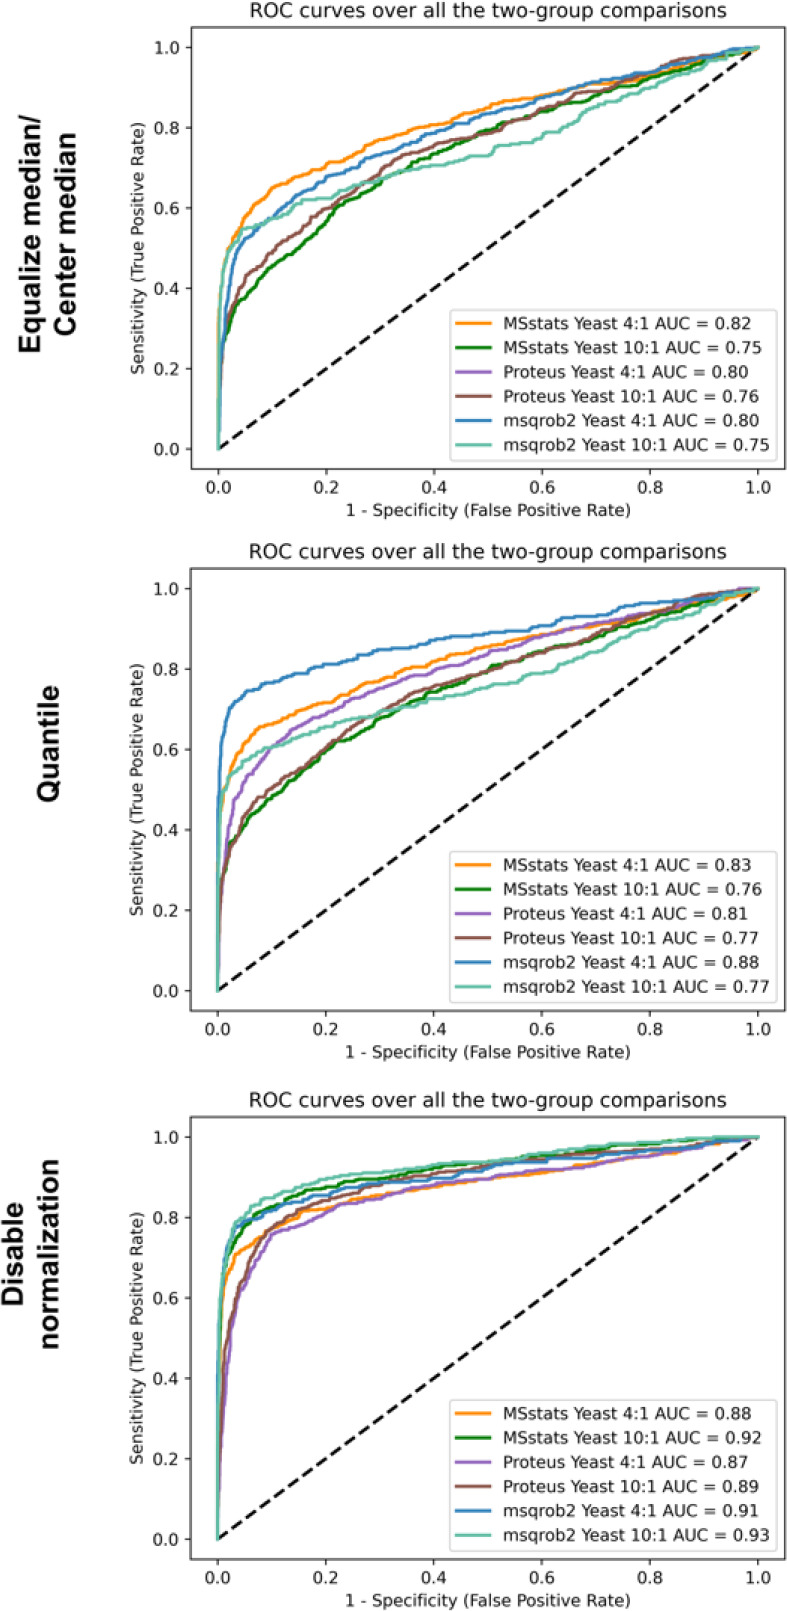
Figure 2.

ROC plots from MSstats, msqrob2 and Proteus for large-scale mix data set analyzed with quantms. The figure highlights the sensitivity and specificity of the tools in classifying proteins with significant fold changes under different normalization settings. The underlying protein quantities have been generated starting from the peptide intensity table output of quantms.
