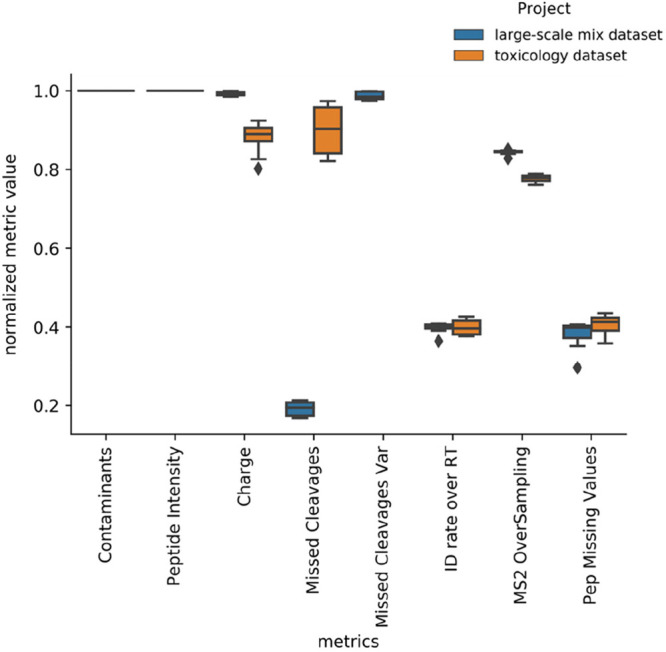
Figure 3.

Distribution of metrics including contaminants, peptide intensity, charge, missed cleavages, identification rate over retention time, MS2 oversampling, and peptide missing values for the large-scale mix data set and toxicology data set analyzed with quantms. The normalized metric value (y-axis) is the normalized value for each specific metric between 0 and 1.
