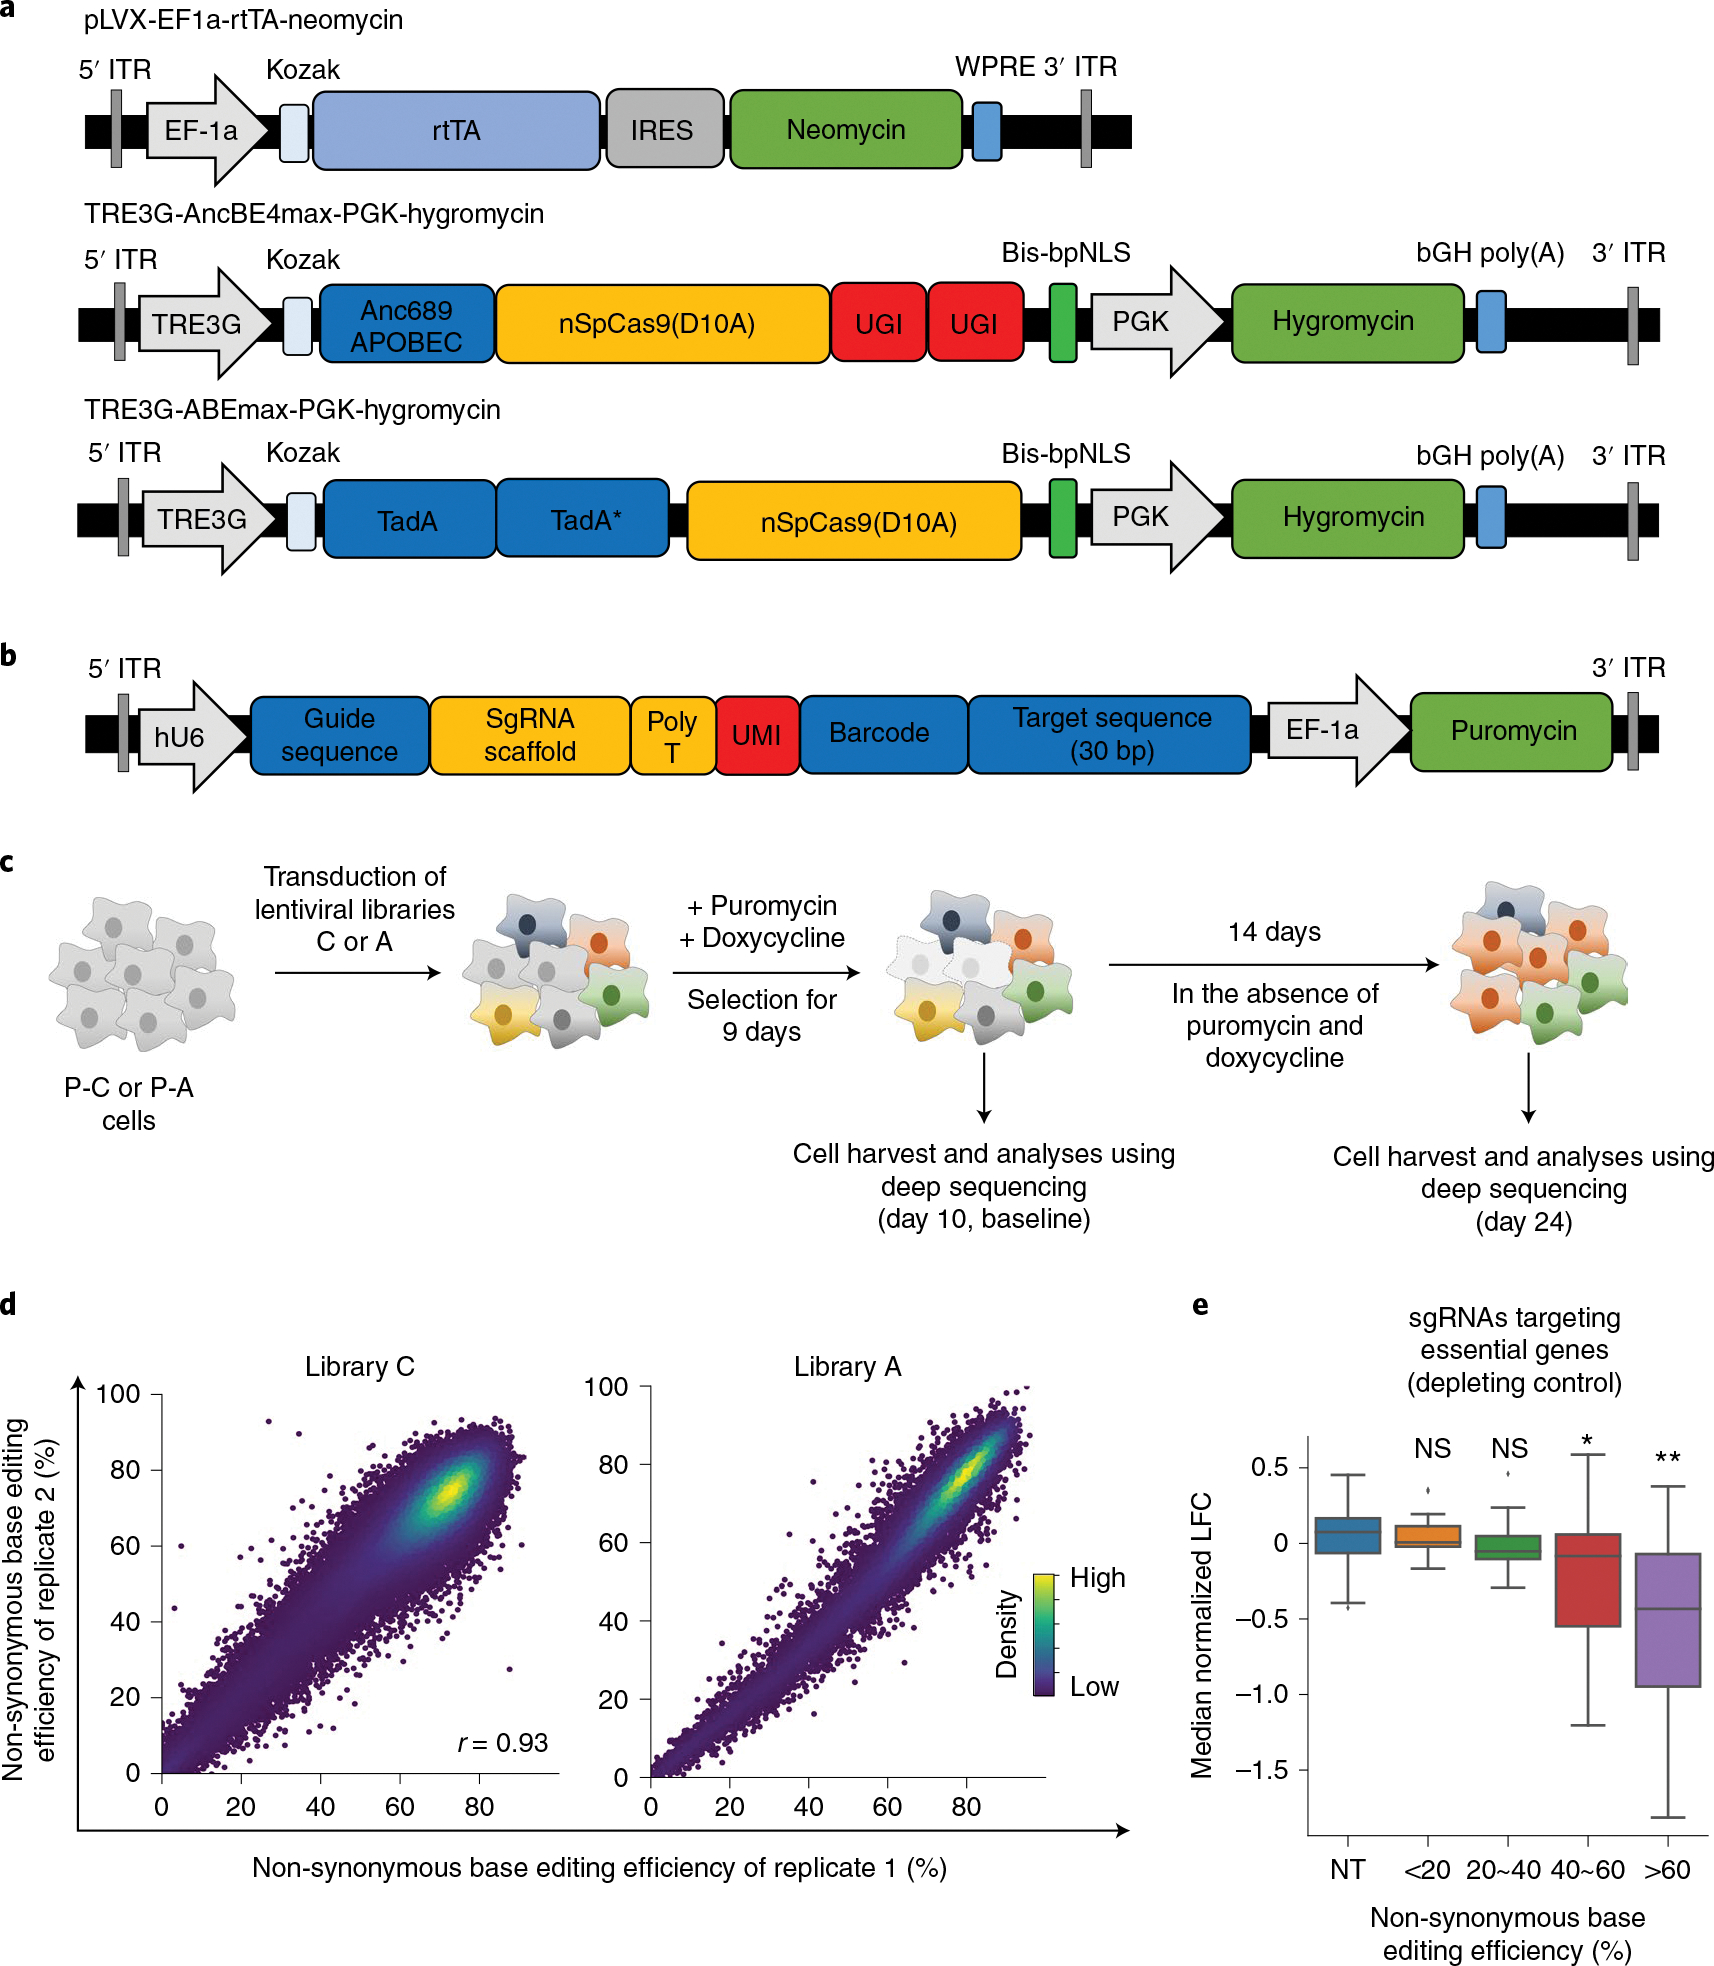
Fig. 1 |. Base editor-directed generation of cancer-associated transition mutations.

a, Maps of lentiviral vectors used for the expression of rtTA (pLVX-EF1a-rtTA-neomycin), CBE (TRE3G-AncBE4max-PGK-Hygromycin) and ABE (TRE3G-ABEmax-PGK-Hygromycin). These vectors were used to generate P-C cells and P-A cells. Anc689APOBEC, codon-optimized ancestral APOBEC1 (AncBE4max);26 TadA, tRNA adenosine deaminase;80 bis-bpNLS, biparticle nucleus localization signal at both the N- and C-termini;26 TRE3G, tetracycline response element 3G promoter. b, A map of the lentiviral vector containing the library of sgRNA-encoding sequence and surrogate target sequence pairs. c, Schematic of CBE-mediated and ABE-mediated high-throughput evaluations of variants. P-C cells and P-A cells are non-tumorigenic human bronchial epithelial cells that express CBE and ABE, respectively, in a doxycycline-dependent manner. P-C cells and P-A cells were transduced with lentiviral sgRNA libraries C and A, respectively. In different replicates, cells were transduced with different batches of the lentiviral library on different days. Untransduced cells were removed by puromycin selection, and the expression of CBE or ABE was induced for 9 days by doxycycline. Ten days after the transduction, half of the cells were harvested for analyses, and the remaining cells were cultured in the absence of puromycin and doxycycline for another 14 days, after which these cells were also analyzed. d, Correlations between non-synonymous base editing efficiencies at the integrated target sequences of biological replicates. The color of each dot was determined by the number of neighboring dots (that is, dots within a distance that is three times the radius of the dot). Pearson correlation coefficients (r) are shown. e, Distribution of median normalized LFCs of 190 sgRNAs targeting essential genes depending on the non-synonymous base editing efficiencies determined at the integrated target sequences in library C2. NT, non-targeting sgRNAs. The number of sgRNAs n = 99 (NT), 13 (<20%), 17 (20%~40%), 31 (40%~60%) and 129 (>60%). Box plots are represented as follows: center line of box indicates the median; box limits indicate the upper and lower quartiles; and whiskers show the 1.5 times interquartile range (in comparison with NT; two-sided Student’s t-test; NS, not significant, *P = 6.1 × 10⁻⁷, **P = 2.3 × 10⁻²¹).
